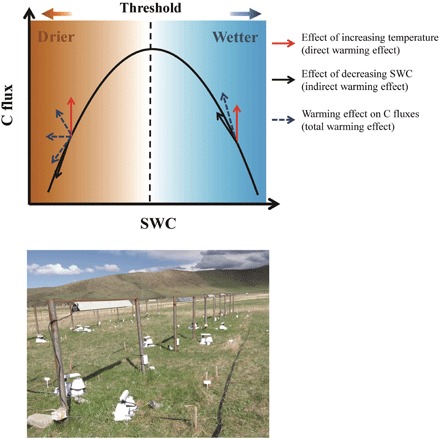
Fig. 1. Conceptual diagram of warming effects on ecosystem C fluxes above and below the SWC optimum.

The red arrows represent the directly positive warming effect on ecosystem C fluxes. The black arrows represent the effect of warming-induced changes in SWC on C fluxes, which is the indirect effect of warming. Below the SWC optimum, the warming-induced decrease in SWC reduces C fluxes; thus, the black arrow points downward along the SWC-C flux response curve. Above the SWC threshold, warming-induced water loss increases C fluxes; thus, the indirect warming effect enhances C fluxes, and the black arrow points upward along the SWC-C flux response curve. The blue dashed arrows represent the final change direction of C fluxes under the combination of both direct and indirect effects of warming. The photograph depicts our field experimental plots at the study site. (Photo credit: Q.Q., Institute of Geographic Sciences and Natural Resources Research, Chinese Academy of Sciences).
