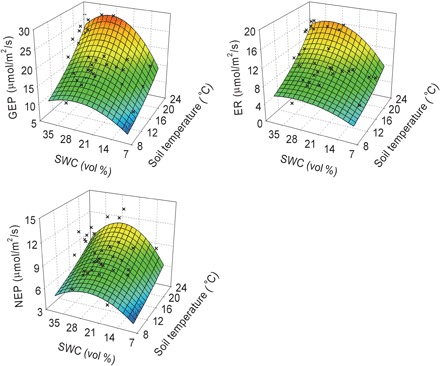
Fig. 2. Response surfaces showing the relationships between ST and SWC versus GEP, ER, or NEP across plots and years.

Observed values (black crosses) are the means of five replications of C fluxes, and modeled values (colored surfaces) are predictions from the models fitted with observations.
