
Fig. 3. The genes and proteins characterizing cytotoxic, exhausted, and aTregs subsets.
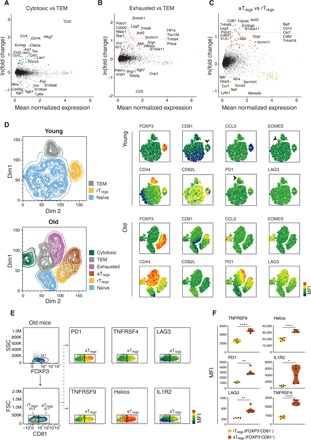
(A to C) MA plots showing differentially expressed genes between (A) cytotoxic and TEM cells, (B) exhausted and TEM cells, and (C) aTregs and rTregs cells. Only cells from old mice were considered in the analysis. Each dot represents a gene; genes that were up-regulated consistently across mice [ln(fold change) > 0.4] were colored by the corresponding subset. (D) Left: Representative t-SNE plots of CD4 T cells coming from young (top) and old (bottom) mice colored by subset identity. Right: Analysis was based on the expression of 10 marker proteins chosen according to the gene expression profiles. The mean fluorescence intensities (MFIs) of each marker are presented. (E) Representative flow cytometry plots gated on FOXP3+ cells showing the MFI of selected marker proteins that relate to Tregs activation, projected on CD81− (rTregs) and CD81+ (aTregs) populations. (F) Violin plots quantitatively showing the MFI of each marker in rTregs and aTregs. Each dot represents a mouse (n = 6, from two different experiments). Paired t test, *P < 0.05, **P < 0.01, and ****P < 10−4.