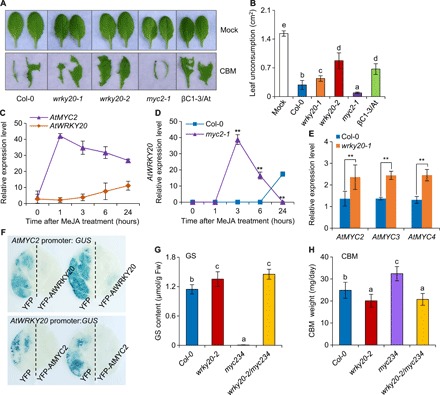
Fig. 3. The βC1 interaction partners WRKY20 and MYC2 form a negative regulation feedback loop.

(A) Phenotypes of 6-week-old Arabidopsis leaves after CBM infestation for 12 hours. (B) Nonconsumed leaf areas were recorded after CBM infestation for 12 hours on Arabidopsis leaves. Bars represent means ± SD (n = 6). (C) Relative expression levels of AtMYC2 and AtWRKY20 in Col-0 treated with methyl JA (MeJA). (D) Relative expression level of AtWRKY20 in Col-0 and myc2-1 plants treated with MeJA. (E) Relative expression levels of AtMYC2, AtMYC3, and AtMYC4 in Col-0 and wrky20-1 plants after 6 hours of MeJA treatment. (F) AtMYC2 promoter activity in YFP-expressing and YFP-AtWRKY20–expressing leaves by β-glucuronidase (GUS) staining and AtWRKY20 promoter activity in YFP-expressing and YFP-AtMYC2–expressing leaves by GUS staining. (G) Total GSs content of 6-week-old Arabidopsis plants. Bars represent means ± SD (n = 4). Fw, fresh weight. (H) Growth rate of CBM reared on Arabidopsis plants. Bars represent means ± SD (n = 10). (B, G, and H) Means with different letters (a, b, c, d, and e) are significantly different (P < 0.05, one-way ANOVA along with Duncan’s multiple range test). (C to E) Bars represent means ± SD (n = 3) (**P < 0.01, Student’s t test). Photo credit: Pingzhi Zhao, Chinese Academy of Sciences.
