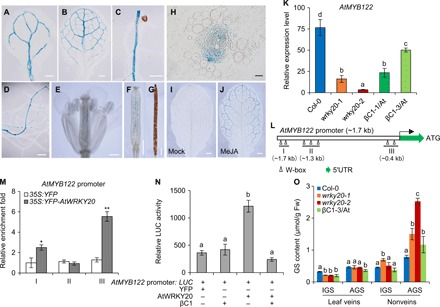
Fig. 4. βC1 regulates WRKY20-mediated GS biosynthesis in a vascular-specific manner.

(A to G) AtWRKY20 promoter activity in a cotyledon (A), first rosette leaf (B), roots (C and D), inflorescence (E), and siliques (F and G). Scale bars, 1 mm. (H) Resin root slice of the AtWRKY20 promoter: GUS lines. Scale bars, 20 μm. (I and J) GUS staining of the leaves of 6-week-old plants before (I) and after (J) MeJA treatment in AtWRKY20 promoter: GUS lines. Scale bars, 2 mm. (K) Relative expression level of AtMYB122 in 6-week-old Arabidopsis plants after 6 hours MeJA treatment. Bars represent means ± SD (n = 3). (L) Schematic diagram of the AtMYB122 promoter. The small hollow triangles represent W-box motifs in the schematic diagram of the promoters. ATG indicates the coding initiation site of a gene. Three lines under triangles represent various DNA fragments were amplified in ChIP assay. (M) Fold enrichment of YFP-AtWRKY20 associated with DNA fragments of the AtMYB122 promoter in a ChIP assay. Enrichments are referred to the 35S:YFP-AtWRKY20 or 35S:YFP against wild-type Col-0 seedlings. Bars represent means ± SD (n = 4) (*P < 0.05 and **P < 0.01, Student’s t test). (N) Effects of βC1 on the transactivation activity of AtWRKY20 on the AtMYB122 promoter. Bars represent means ± SD (n = 8). (O) Contents of AGS and IGS in leaf veins and nonveins, respectively, of 6-week-old Arabidopsis plants after 6 hours of MeJA treatment. Bars represent means ± SD (n = 4). (K, N, and O) Means with different letters (a, b, c, and d) are significantly different (P < 0.05, one-way ANOVA along with Duncan’s multiple range test). Photo credit: Pingzhi Zhao, Chinese Academy of Sciences.
