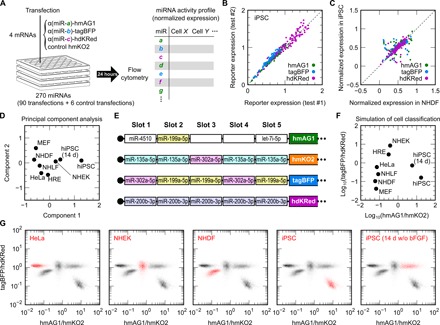
Fig. 4. Classification of living cells by a set of five-slot mRNAs based on miRNA activity profiles.

(A) Schematic illustration of the miRNA activity screening. A set of three single-slot mRNAs that respond to distinct miRNAs (miR-a, miR-b, and miR-c) and encode hmAG1, tagBFP, and hdKRed, respectively, and control hmKO2 mRNA were transfected into target cultured cells on a 24-well plate. The cells were analyzed by flow cytometry 24 hours later. The right table depicts miRNA activity profiles in analyzed cell types, which are determined on the basis of the expressions of the single-slot reporter mRNAs. Four plates (96 transfections) covered the screening of 270 miRNAs, as well as control transfections. (B) Obtained reporter expressions in hiPSCs from two independent screenings. Green, blue, and purple dots indicate single-slot mRNAs encoding hmAG1, tagBFP, and hdKRed, respectively. (C) Comparison of normalized miRNA activity profiles in NHDFs and hiPSCs. The normalized expressions are the mean of two screenings. See Supplementary Text and fig. S3 for details. (D) Classification of eight cell types by PCA of the 270 miRNAs. The cell types are plotted on the first two components (components 1 and 2). (E) The design of a set of four five-slot mRNAs that maximizes the variance of the eight cell types. Slots are occupied by the target sequence to the indicated miRNAs. Blank boxes denote empty slots. (F) Simulated classification of the eight cell types with the transfection of the mRNA set shown in (E). Axes are the fluorescence ratios of hmAG1/hmKO2 and tagBFP/hdKRed. (G) Live cell classification with the set of the four synthetic mRNAs and flow cytometry. Merged density plots of the transfected cells on the two fluorescence ratios are shown. The indicated cells are presented in red density, other cells in black density.
