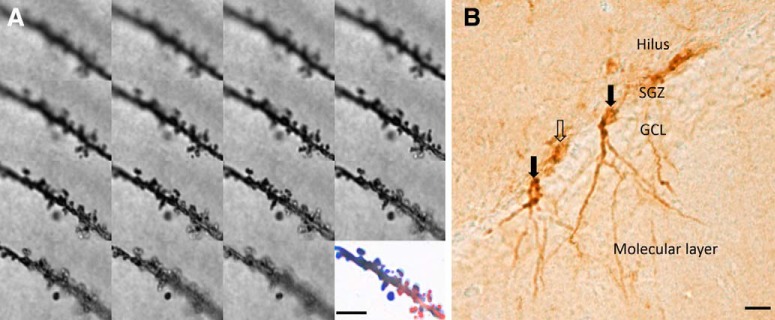
Figure 1.
Representative examples of an image stack from Golgi-stained dendritic segment of a CA1 basal arbor before and after image processing used for subsequent spine density and clustering analysis (A) and DCX-positive cell types (B). Unfilled arrow points to an immature DCX cell. Filled arrows indicate mature DCX cells used in Sholl analysis. GCL, Granule cell layer; SGZ, subgranular zone. Scale bars: A, 5 μm; B, 20 μm.

