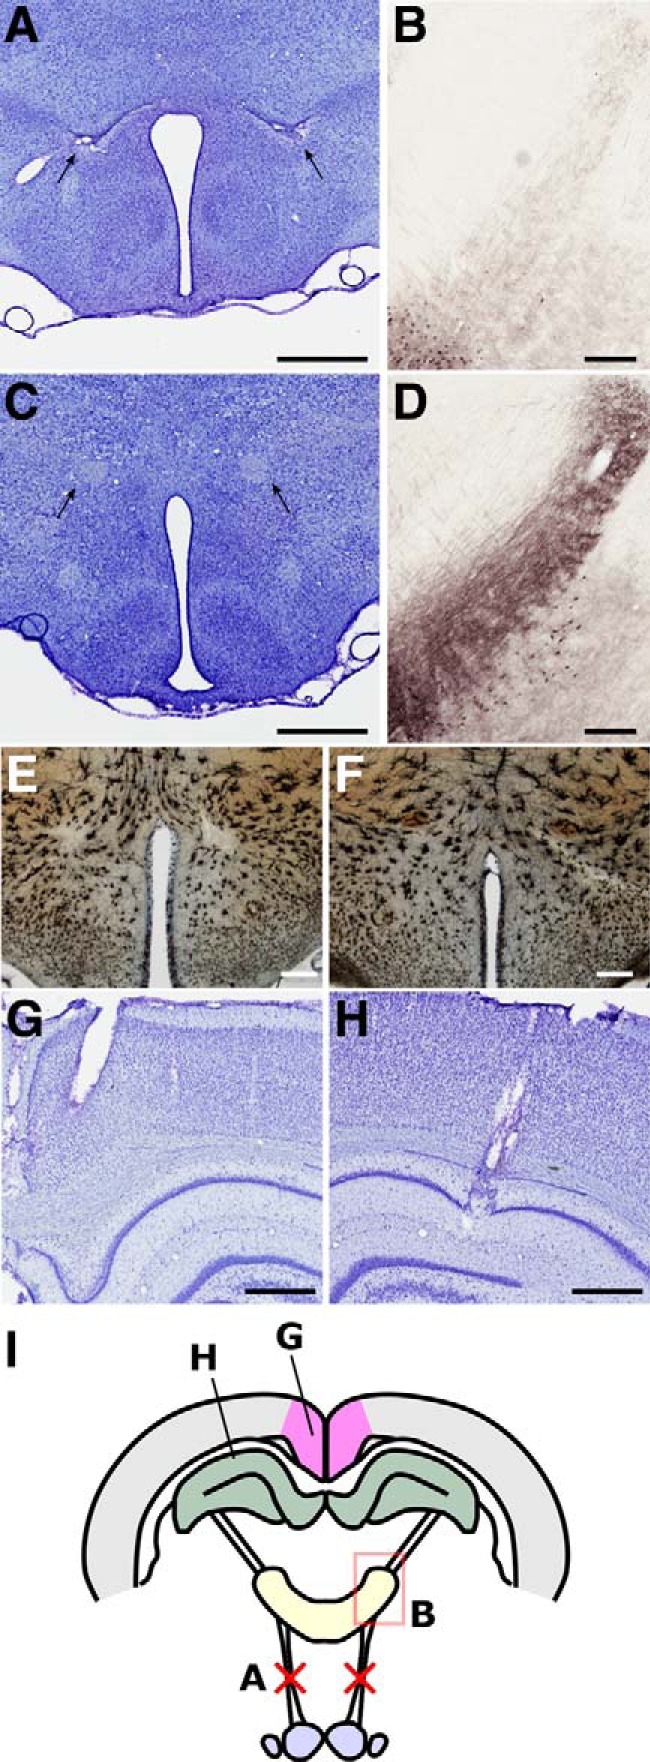
Figure 2.

A, C, Arrows indicate the location of the MTT in representative lesion and control cases, respectively, whereas lesion-induced reduction in calbindin immunoreactivity in the anteroventral nucleus of the thalamus (B) compared with controls (D) provided additional verification of lesion success. E, F, Golgi-stained tissue showing the MTT in a control (E) and an example MTT lesion (F). G, H, Nissl-stained verification of representative electrode placements in the RSC (G) and CA1 subfield of the hippocampus (H). I, Schematic diagram showing the experimental approach. Red crosses represent the MTT lesions. Scale bars: B, D, 250 μm; all others, 500 μm.
