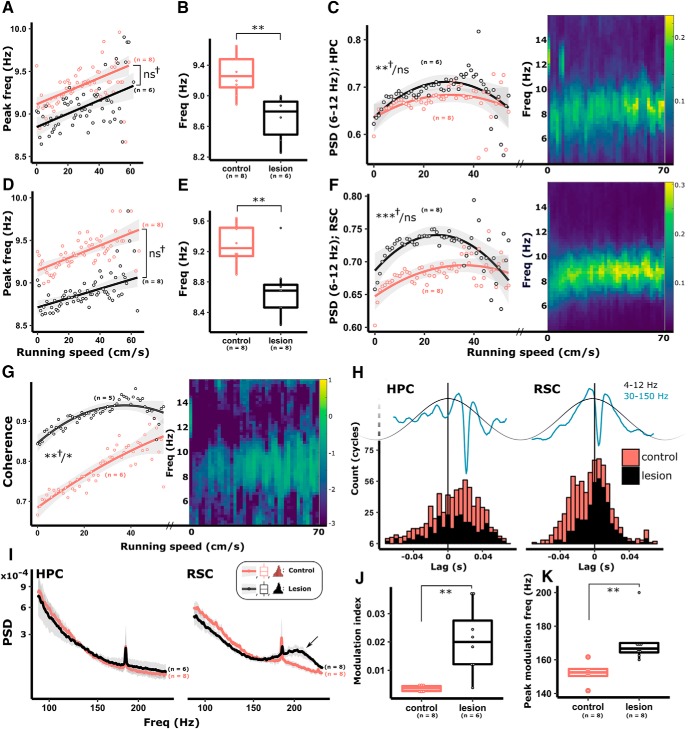
Figure 4.
In control animals, both peak theta frequency and theta power (PSD) are modulated by running speed in HPC (A–C) and RSC (D–F). In animals with MTT lesions, the HPC power-speed relationship was intact (C). Although the relationship between peak theta frequency and running speed was intact in lesioned animals (A, HPC; D, RSC), peak theta frequency was significantly attenuated across the range of measured speeds in both HPC (B) and RSC (E). Theta-band coherence between HPC and RSC is positively correlated with running speed (G). C, F, G, Heat maps represent higher theta power in HPC, RSC, and theta-band coherence between the two regions, respectively, increasing with speed in individual, representative control animals. Theta-band coherence between HPC and RSC in lesioned animals was significantly greater across speed bins (G); however, lesion animals had an intact relationship between theta coherence and running speed (G). H, Gamma band (30–150 Hz) trough-triggered averages of theta (4–12 Hz) oscillations were used to calculate the time lag from the theta cycle peak. Consistent with previous studies (Belluscio et al., 2012), gamma power was most strongly associated with the descending phase in HPC and the peak of the theta cycle in RSC with no difference between treatment groups. Gamma power during locomotion was unaffected by MTT lesions; however, increased power in the 180–240 Hz range (HFOs) was observed in RSC (I, right, arrow). Corresponding increases in phase amplitude coupling in the corresponding frequency range were observed in RSC (J, K), reflecting the increased HFO. **p < 0.01, *p < 0.05. ns, not significant, †Results of speed/treatment interactions. Color key in I applies to all graphs in the figure. Red represents control. Black represents lesion.

