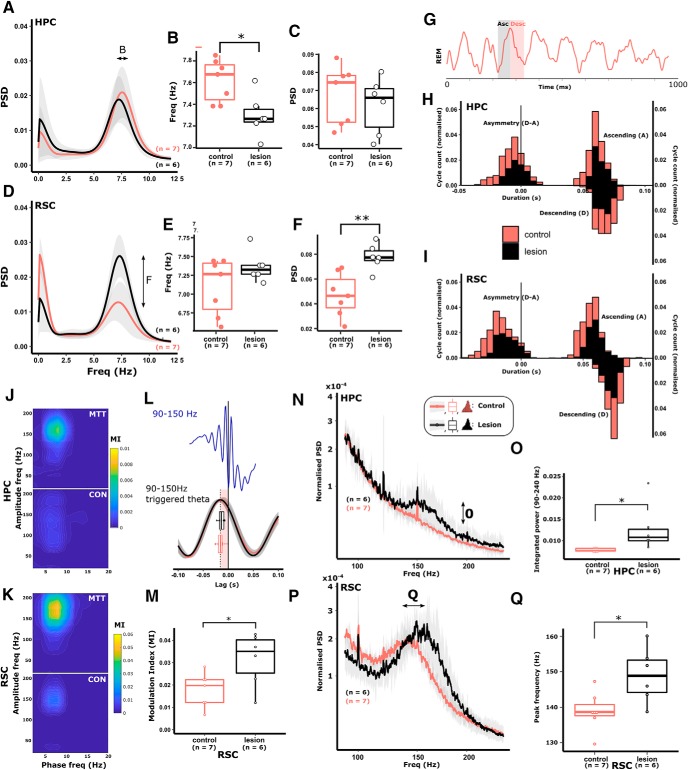
Figure 6.
During PS, hippocampal theta frequency, but not power, was significantly attenuated (A–C), whereas cortical theta power, but not frequency, was significantly greater (D–F). G, A typical LFP trace from HPC during PS. Shaded gray represents ascending phase. Shaded red represents descending phase. H, I, Lesion of the MTT did not influence the absolute asymmetry of theta cycles in either the HPC (H; left histogram) or the RSC (I; left histogram) as reflected by consistent, overlapping distributions of ascending and descending phase durations in both HPC and RSC (right histograms in H and I, respectively). During PS, strong theta-gamma phase-amplitude coupling is present in the fast gamma frequency range (90–150 Hz; J). The degree to which theta and fast gamma are coupled (MI) was significantly increased in both HPC (J) and RSC in lesioned animals (K, M), whereas the time lag between the peak of the theta cycles, and the troughs of fast-gamma oscillations (>2 SDs of the baseline power) remained consistent between treatment groups (L). L, The average theta waveform triggered by the trough of fast-gamma (90–150 Hz) oscillations (time = 0 s). Shaded red area represents the time lag between the trough of the gamma oscillations and the peak of the preceding theta peak, with corresponding box plots representing the very similar means, and variance of time lags compared between lesion (black) and control (red) animals. Lesion-dependent increases in phase-amplitude coupling in both HPC (N, O) and RSC (P, Q) were therefore the product of increased high-frequency power at frequencies that corresponded to the coupling observed in J and K. Color key in N applies to all graphs in the figure: Red represents control. Black represents lesion. *p < 0.05; **p < 0.01.

