Figure 8.
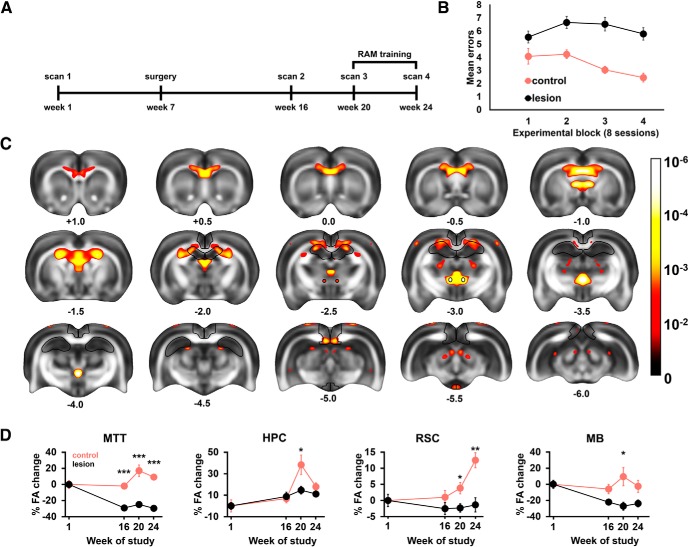
Animals were scanned at four time points over a 6 month period (A); surgeries were performed during week 7. MTT lesion rats (n = 13; controls, n = 7) were impaired on a radial-arm maze task (B). Changes in FA elicited by MTT lesion and radial-arm maze training are shown as results of an ANOVA with the between-factor of surgery (two levels) and the within-factor of scan number (four levels). Significant voxels have been thresholded to α < 0.01 and displayed using a heat map overlaid on top of a mean FA template (C). Successive coronal levels are numbered according to distance from bregma (mm). Outlines designate anatomical structures from which ROIs for regional analyses were selected (at α < 0.005). C, The heatmap calibration bar represents p values on a logarithmic scale (−Log10). Graphs showing the timeline of regional changes in the MTT, hippocampus (HPC), RSC, and the MBs with the y axis displaying changes from the mean baseline (prospective lesion and control cases) values at Scan 1 (D). Error bars indicate SEM. *p < 0.05; **p < 0.01; ***p < 0.001.

