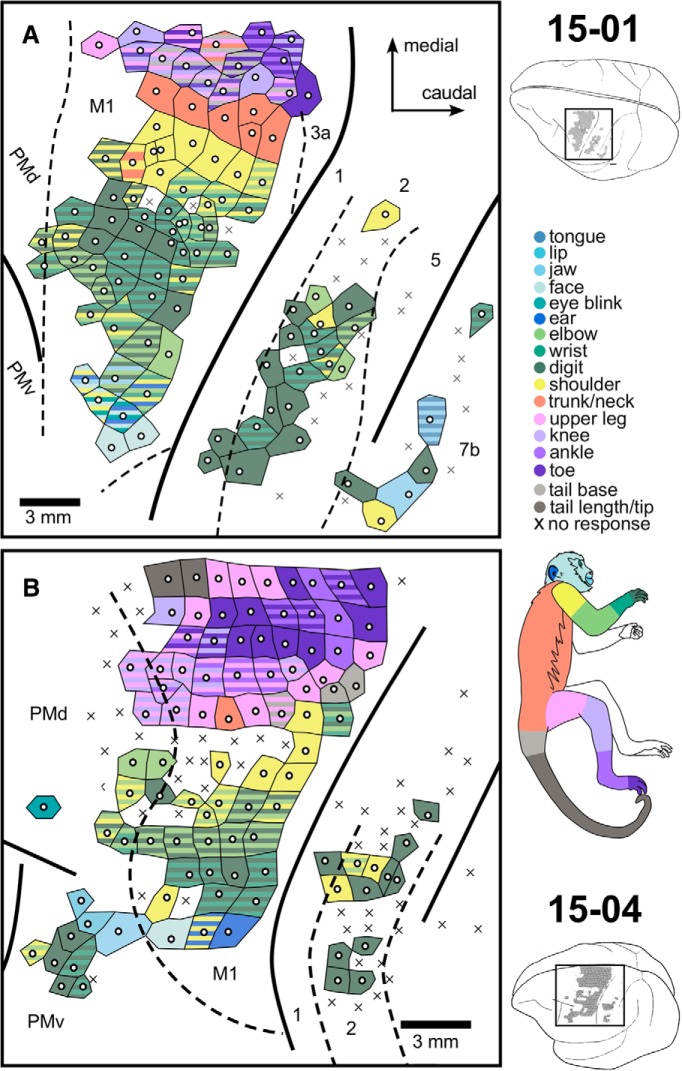
Figure 1.
LT-ICMS map for Cases 15-01 and 15-04. Enlarged representation of the cortical surface region mapped in the frontal and parietal cortex of the left hemisphere of Cases 15-01 (A) and 15-04 (B), corresponding to the black rectangles in the brain drawings (top and bottom right corners). Movements here were categorized according to the body part(s) that moved during LT-ICMS. White dots represent the electrode penetration site. Tiles surrounding the white dots represent the body part(s) involved in the evoked movement according to the color code at right. Striped tiles represent movements involving multiple body parts. X's indicate sites where no movement was elicited during LT-ICMS. Dashed lines indicate anatomical borders between cortical areas defined by Nissl-stained sections.

