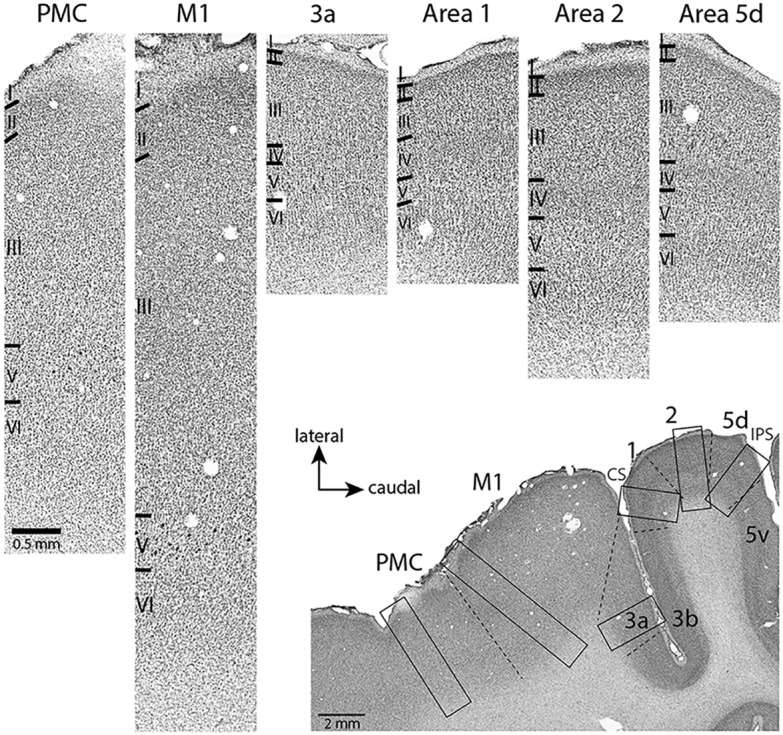
Figure 3.

Photomicrographs showing the architecture of frontal and parietal areas revealed by Nissl staining. Photomicrographs at the top were all taken from the same horizontal section shown in right bottom corner. Black rectangles correspond to cortical regions enlarged above. Dashed lines indicate anatomical borders. The scale bar in the top left image (PMC) is the same for all top images. PMC, Premotor cortex.
