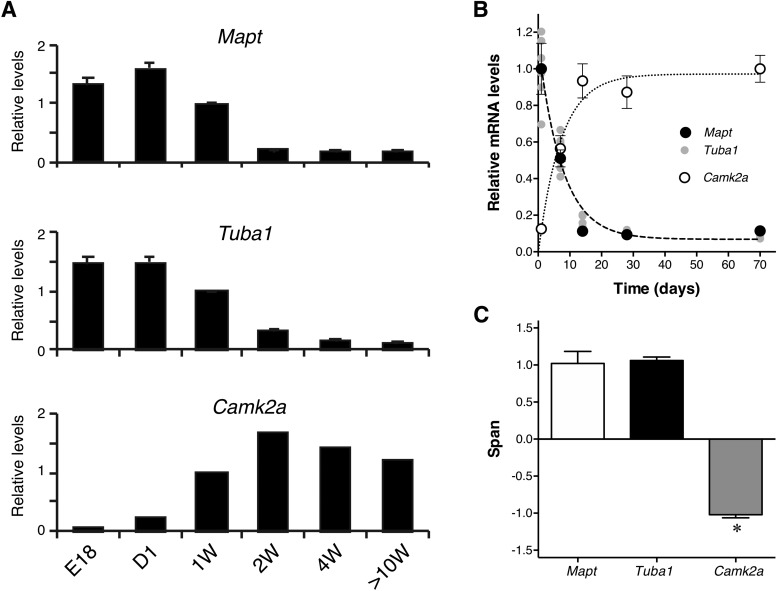
Figure 10.
Developmental expression of endogenous tau in the mouse brain. A, Relative levels of mRNA of tau (Mapt),-tubulin (Tuba1), and CaMKII (Camk2a) at E18, 1 d (D1), 1 week (1W), 2 weeks (2W), 4 weeks (4W), and 10–13 weeks (10W) after birth in the cerebral cortices of non-Tg mice were quantified using qRT-PCR. The levels were normalized to that at 1 week for each gene. B, Data in A were analyzed using nonlinear regression with single exponential curves (top). C, The span of the function in B (see Materials and Methods) was obtained from each animal, and the averages were compared among the three genes using repeated-measures ANOVA with Tukey test (F(1.202, 3.605) = 168.1, p = 0.0003).

