Figure 2.

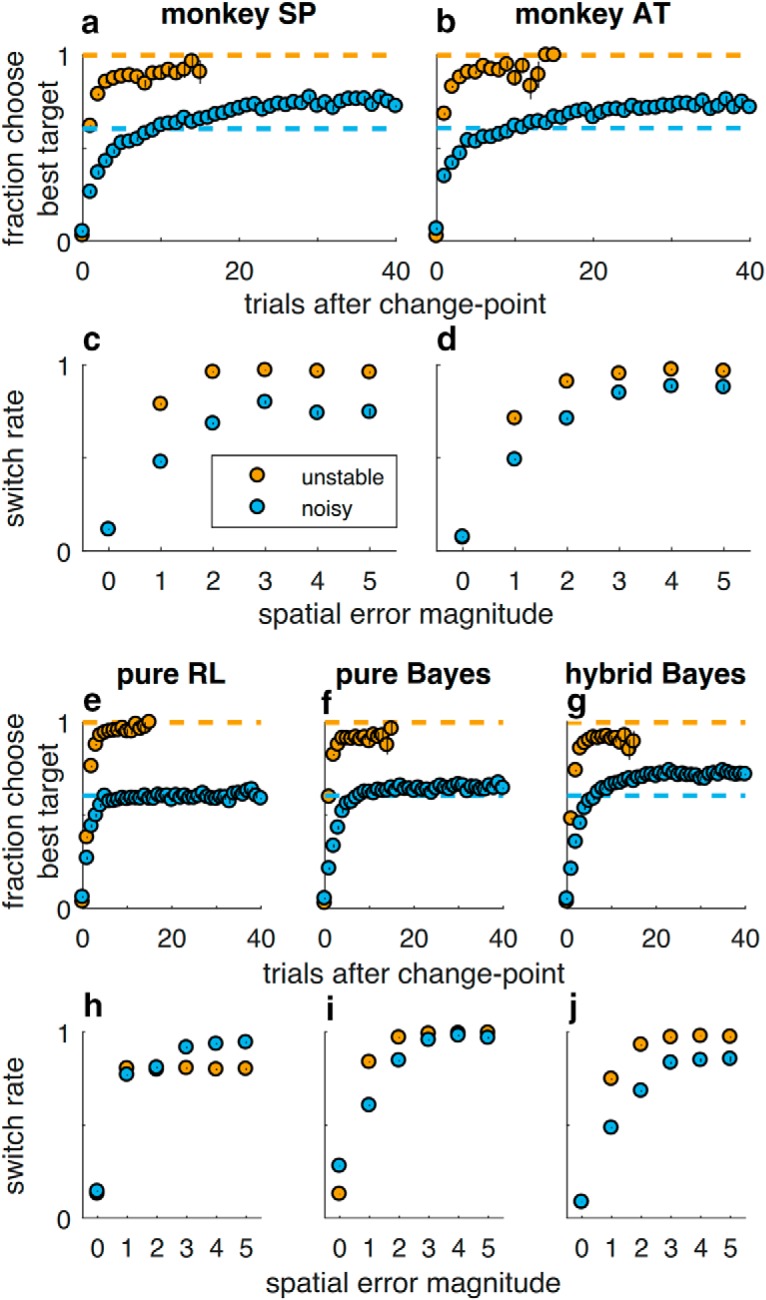
Adaptive, feedback-driven behavioral performance. Behavioral data from Monkeys SP and AT (top rows) and simulated behavioral data from median best-fit parameters of three behavioral models (bottom rows). a, b, e–g, Fraction of trials picking the best target as a function of trials after change-point, plotted separately for unstable (yellow) and noisy (blue) conditions. Dashed lines indicate the fraction of trials in which the best target was rewarded for each task conditions. c, d, h–j, Probability of switching to a different target on the following trial, per condition, as a function of the spatial error magnitude (the number of target locations between the chosen target and the reward target). Switch probability depended on spatial error magnitude (Spearman's ρ = 0.62 for Monkey SP and 0.67 for Monkey AT, p < 0.001 for both) and task condition (partial ρ accounting for spatial error magnitude = −0.15 for Monkey SP, −0.10 for Monkey AT, p < 0.001 for both), particularly for small errors (median difference for errors of 1 and 2 = −0.31 vs 3+ errors = −0.17 for Monkey SP, Wilcoxon signed-rank test, signed rank = 55.0, p < 0.001; −0.24 vs −0.09 for Monkey AT, signed rank = 47.0, p < 0.001). Colors as in a. In all panels, points/error bars indicate mean/SEM across all trials from recording sessions.
