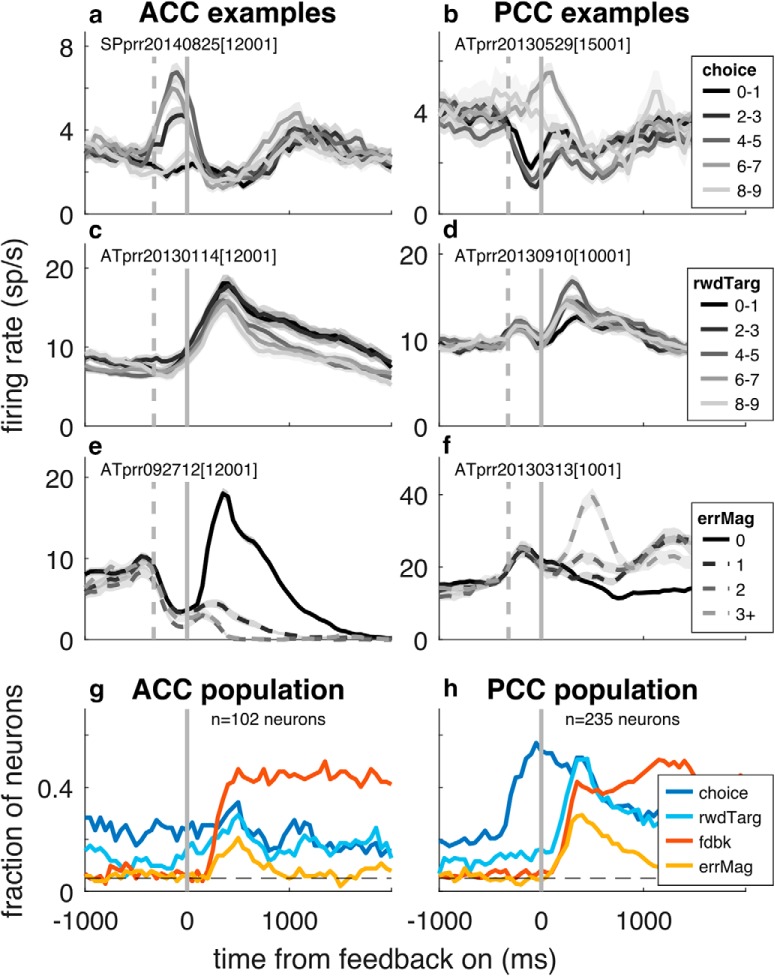
Figure 5.
Neuronal selectivity for choice and feedback in ACC (left) and PCC (right). a–f, Example neurons illustrating neural selectivity for the following: a, b, the spatial location of the chosen target (numbered 0–9, indicating the location clockwise from directly right of fixation) determined from all correct and error trials; c, d, the spatial location of the rewarded target, numbered as in a, b and determined from all correct and error trials; and e, f, spatial error magnitude. Thick lines/ribbons indicate mean/SEM firing rates in 250 ms sliding windows. Dashed vertical gray lines indicate median times of saccade onset. Solid vertical lines indicate time of feedback onset. g, h, Population selectivity for ACC and PCC for the indicated task variables, based on GLM (Eq. 11) applied to firing rates in 250 ms bins stepped in 50 ms increments (p < 0.05). All panels represent data aligned to feedback onset.

