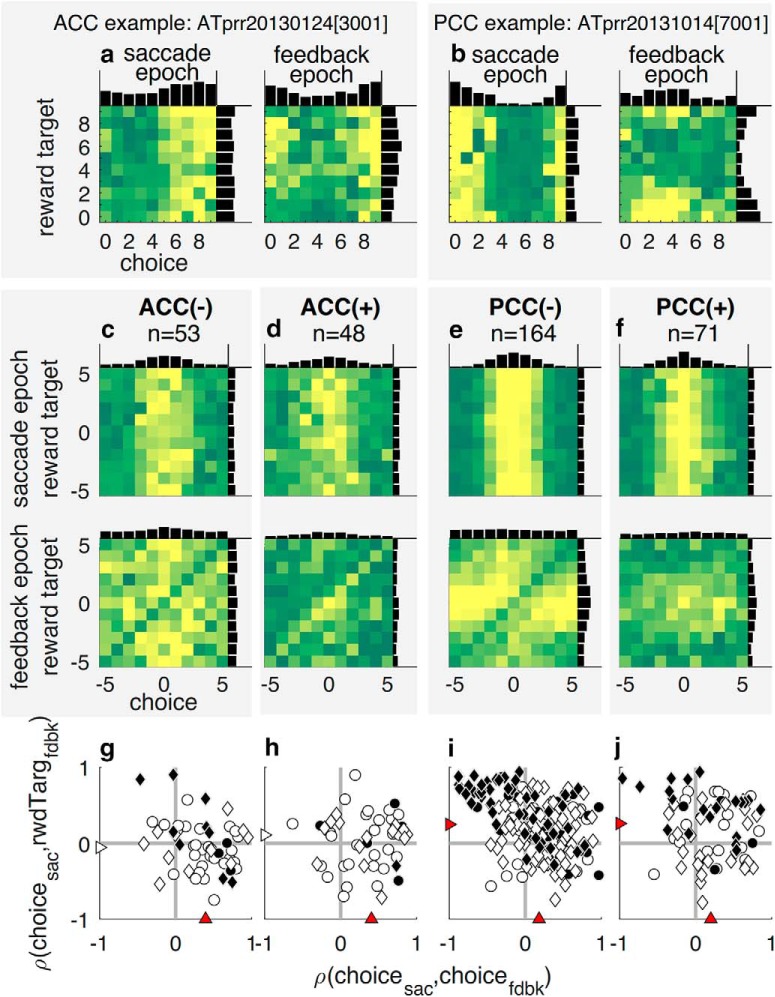
Figure 7.
Neuronal encoding of spatially selective choice and reward-target signals. a, b, Example neurons from ACC (a) and PCC (b) illustrating spatial neural selectivity, with heatmaps showing joint histograms of firing rate as a function of both choice (horizontal axis) and reward target (vertical axis) during the postsaccade and feedback epochs. c–f, Population joint histograms for ACC (left two columns) and PCC (right two columns) neurons, averaged over z-scored firing rates of error-preferring (−, c, e) and correct-preferring (+, d, f) neurons. Abscissa indicates the location of the chosen target on the given trial, aligned with respect to each neuron's preferred choice-target location. Ordinate indicates the location of the reward (feedback) target, aligned with respect to each neuron's preferred choice-target location. Negative/positive values are counterclockwise/clockwise with respect to the preferred target. The color of each pixel is proportional to the mean firing rate across neurons (yellow represents higher firing rates) for the given choice (abscissa)/reward-target (ordinate) combination, measured in the postsaccadic (top row) or feedback (bottom row) epoch. Thus, a vertically aligned yellow streak indicates consistent choice tuning, whereas a horizontally aligned yellow streak indicates consistent reward-target tuning. Neurons were identified as (−) or (+) based on the sign of the coefficient for feedback (β5) in GLM (Eq. 11). Marginal distributions are plotted along the edges in black in a–f. g–j, Relationship between choice tuning during the postsaccadic epoch and reward-target tuning during the feedback epoch (ordinate; positive/negative values of Spearman's ρ imply that the given neuron tended to have matching/opposite selectivity for choice and reward feedback) is plotted against the relationship between choice tuning during the postsaccadic epoch and choice tuning during the feedback epoch (abscissa; positive/negative values imply that the given neuron tended to have matching/opposite choice selectivity at the two time points). Triangles along the axes represent the median correlation coefficients. Red triangles represent H0: median = 0 (Wilcoxon signed-rank test, p < 0.05). Circle represents Monkey SP; diamond represents Monkey AT. Filled symbols represent neurons selective for both choice and reward-target locations during the feedback epoch, according to GLM (Eq. 11).

