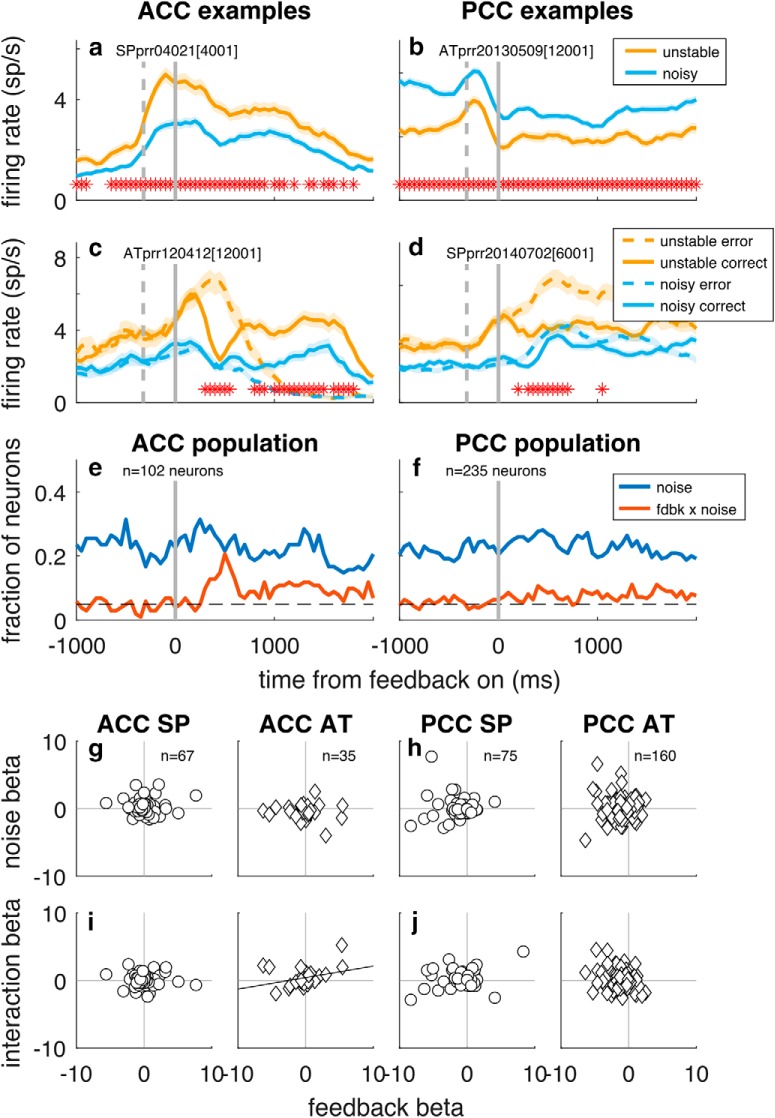
Figure 8.
Little systematic encoding of blockwise noise condition in ACC (left) and PCC (right). a–d, Example neurons that responded differently in unstable versus noisy blocks either overall (a, b) or interacting with feedback responses (c, d). Thick lines/ribbons indicate mean/SEM firing rates in 250 ms sliding windows. Dashed vertical gray lines indicate median times of saccade onset. Solid vertical lines indicate time of feedback onset. Asterisks indicate time bins with different responses in the two blockwise conditions. e, f, Population selectivity for ACC and PCC for the indicated task variables as computed by GLM (Eq. 11), using firing rates in 250 ms bins stepped in 50 ms increments (p < 0.05). a–f, Data aligned to feedback onset. g–j, Population scatter plots showing the absence of a consistent relationship between GLM coefficients for feedback and either noise (g, h) or noise × feedback interaction (i, j), shown separately for each monkey (circle represents Monkey SP; diamond represents Monkey AT). For each scatter plot, the least-squares line is shown if there was a significant correlation coefficient for the associated scatter (p < 0.05, H0: Spearman's ρ = 0).

