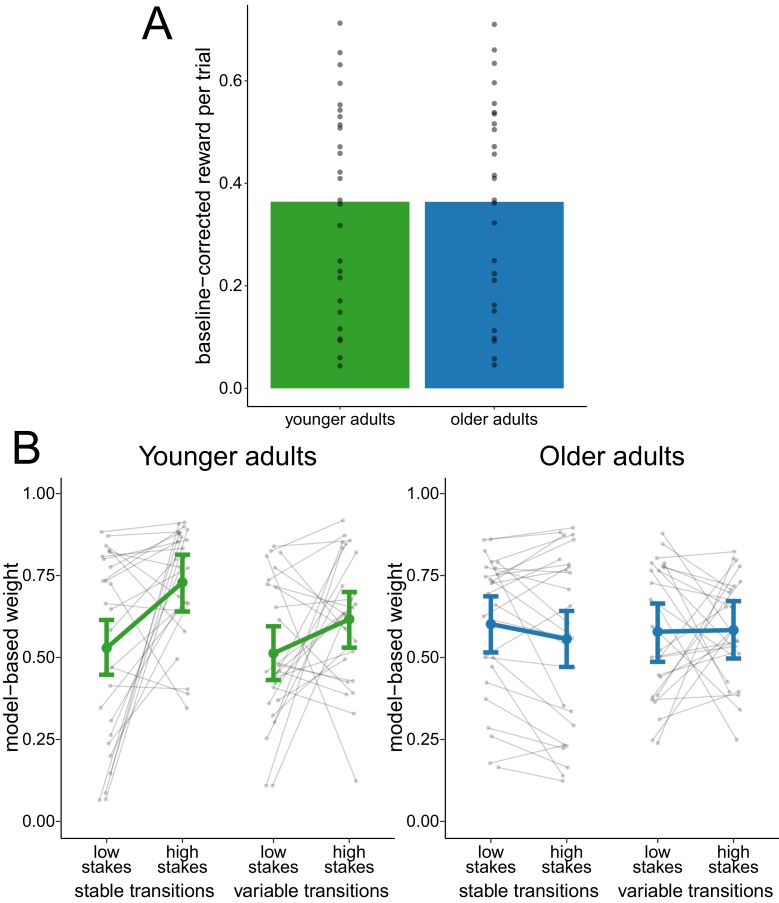
Figure 3. Analysis of performance-matched subsample.
(A) Reward per trial (baseline-corrected) for participants in the performance-matched sample. Gray dots indicate values for individual participants and bars indicate group means. (B) Degree of model-based control for younger and older adults in the performance-matched sample as a function of stakes condition and transition variability condition. Gray dots indicate values for individual participants. Colored dots indicate group means as predicted by the hierarchical regression model with error bars representing Bayesian 95% credible intervals.

