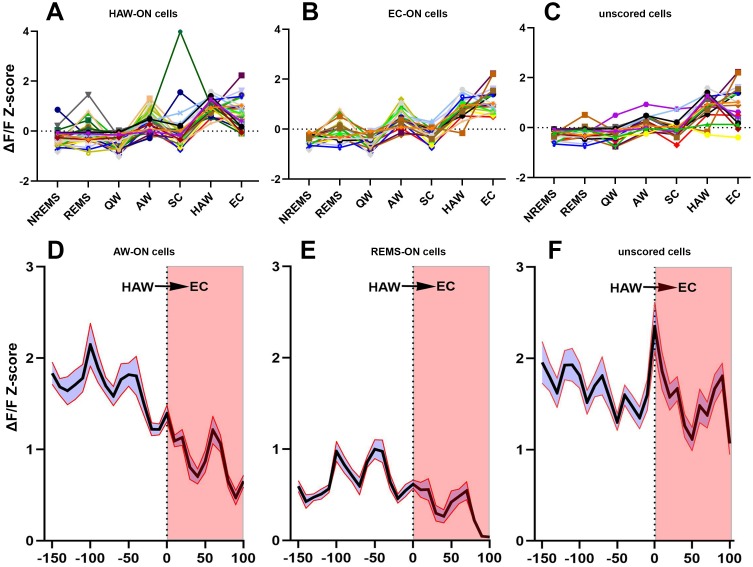
Figure 3. Activities of sorted neurons during sleep/wake cycle and cataplexy.
(A–C) Neuronal activity graphs of 28 HAW-ON cells, 19 EC-ON cells and 17 unscored cells in the narcoleptic mouse LR02082418. Most of the unscored cells displayed significantly elevated activities during HAW and EC (C). (D–F) average Z-score changes during HAW--EC transition from 112 HAW-ON cells, 44 REMS-ON cells, and 79 unscored cells in the narcoleptic group. The durations of cataplexy bouts were normalized as a percentage between 0–100. The average activity of HAW-ON cells stayed high upon odor exposure but gradually decreased during the transition into EC (D). Compared to the low activity of REMS-ON cells (E), unscored cells displayed stronger activation upon odor exposure and maintained the high activity level during EC (F).

