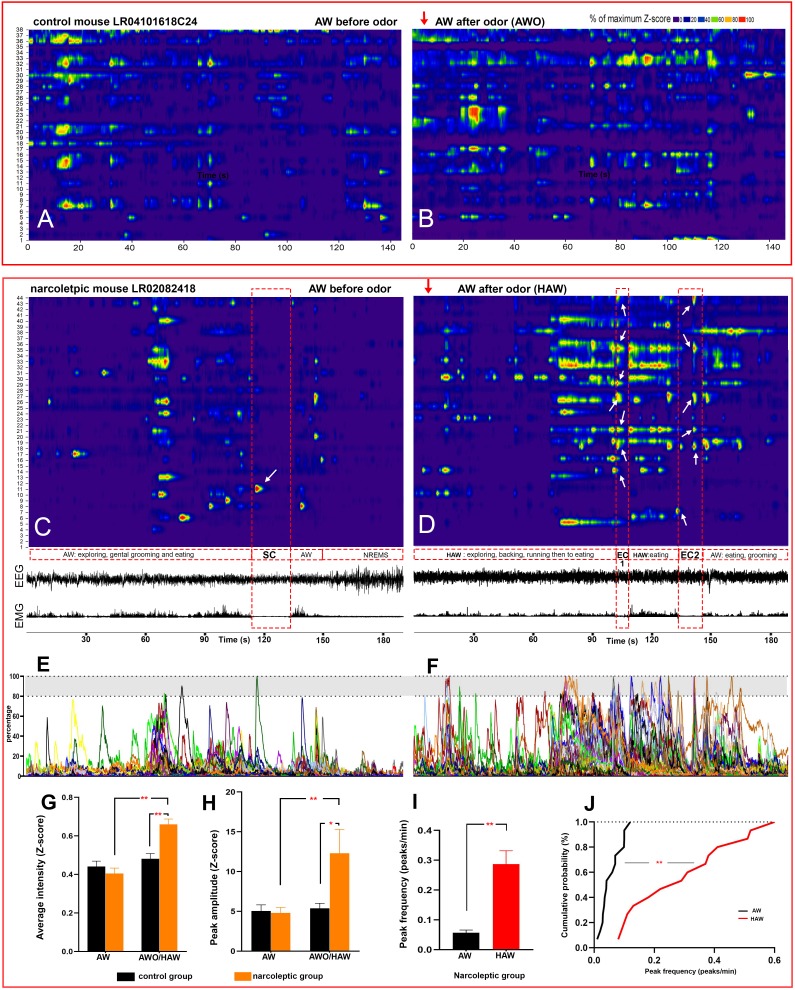
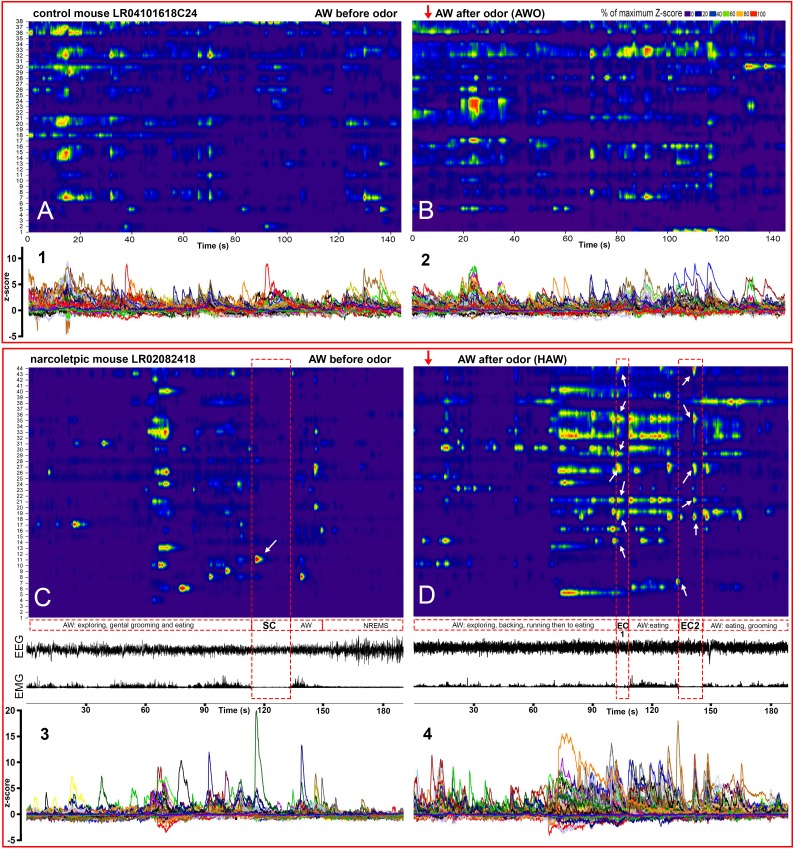
Figure 4. Hyperactivity of amygdala GABAergic neurons before and during emotion-induced cataplexy.
(A–D), heat maps of Ca2+ fluorescent intensity changes before and after coyote urine exposure (red arrows show the starting time of exposure) in control mouse LR04101618. (A and B) and narcoleptic mouse LR02082418 (C, D). The control mouse displayed moderate increases on activity (B) upon exposure to coyote urine. In contrast, the narcoleptic mouse showed dramatic activity changes, with significantly more neurons reaching their maximal activities during the first 3 min of exposure (D and F). A spontaneous cataplexy bout (SC) following a regular AW episode and an SC-ON cell (arrow in C) are shown in (C). Two emotion-induced cataplexy episodes (EC1 and EC2) closely following hyperactive AW (HAW) bouts induced by coyote urine are shown in (D), in which many EC-ON cells reached their maximal activities (arrows). (E, F): Graphs of the percentage to its maximal activity Z-score of each cell in (C) and (D), respectively. Prominent calcium transient peaks (examples are shown in the shadow areas of E and F) were selected for statistical analysis. Odor exposure significantly increased the average calcium signal intensity (G), peak amplitude (H), and peak frequency (I) in the narcoleptic group (*: p<0.05; **: p<0.001). (J): Cumulative probability function shows a significant shift toward a much higher peak frequency after coyote urine exposure in the narcoleptic mice (Matlab Kolmogorov-Smirnov Test: k = 0.73, p<0.001).


