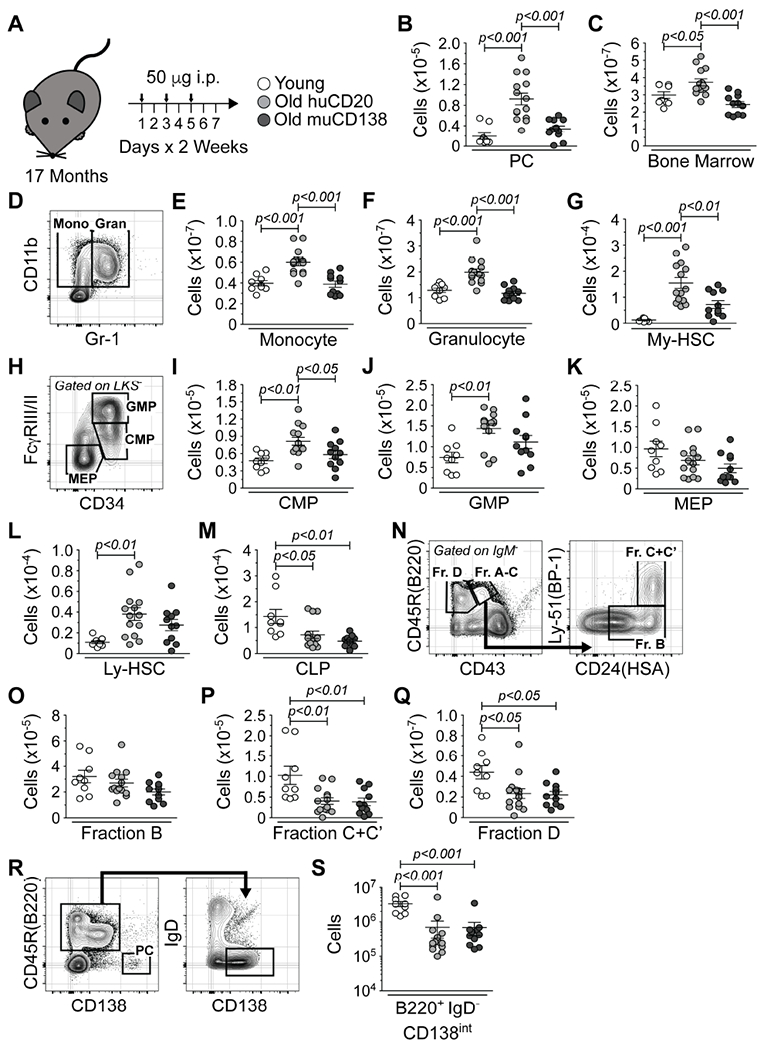
Figure 2. PC Depletion Reverses the Age-associated Enhancement of Myelopoiesis.

(A) Schematic of antibody-mediated depletion of PCs in old mice. Arrows indicate days of injection. (B) Number of PCs in young and huCD20 and muCD138 treated old mice. (C) Total BM cellularity in young, huCD20 and muCD138 treated old mice. (D) Representative FACS plot depicting immunostaining of monocytes and granulocytes in young mice. Numbers of (E) monocytes, (F) granulocytes and (G) My-HSCs in young, huCD20 and muCD138 treated old mice. (H) Representative FACS plot from young mice depicting immunostaining of CMPs, GMPs and MEPs. Numbers of (I) CMPs, (J) GMPs and (K) MEPs in young, huCD20 and muCD138 treated old mice. (L) Numbers of Ly-HSCs and (M) CLPs in young and huCD20 and muCD138 treated old mice. (N) Representative FACS plots from young mice depicting immunostaining of pro-B and pre-B cells. Numbers of (O) Fraction B early pro-B, (P) Fraction C+C’ late pro-B/large pre-B and (Q) Fraction D small pre-B cells in young, huCD20 and muCD138 treated old mice. (R) Representative FACS plots from young mice depicting immunostaining of B220+ IgD™ CD138int immature B lineage cells. The PC containing gated region is provided as a reference point for CD138 staining intensity. (S) Numbers of B220+ IgD™ CD138int immature B lineage cells in young, huCD20 and muCD138 treated old mice. (B, C, E-G, I-M, O-Q, S) Each symbol represents an individual mouse. Animals used: Young = 9; huCD20 = 14; muCD138 = 11. Statistics: One-way ANOVA with Bonferroni’s correction.
See also Figures S2 and S3.
