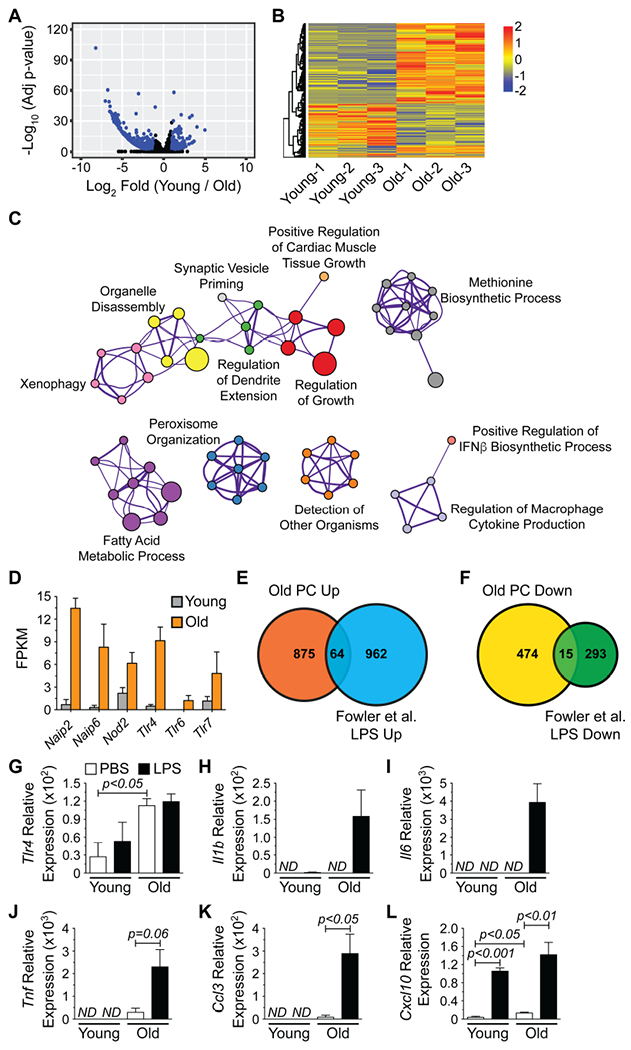
Figure 5. Old PCs Possess a Toll-like Receptor Responsive Gene Signature.

(A) Volcano plot depicting RNA-seq data from young and old PCs. All expressed genes are shown and blue dots indicate genes showing significant (adjusted p-value < 0.05, Log2 fold change > |1.0|) alterations in their expression levels. (B) Heatmap of genes significantly altered between young and old PCs. (C) Cytoscape-generated network diagram summarizing GO analysis performed on genes with increased expression in old PCs using Metascape. Nodes with the same color are specific ontologies in the same GO generic class and are labeled using a representative member. Node size is proportional to the number of genes per category. Edge thickness is proportional to between-node similarity (Kappa similarity >0.3, Metascape) and reflects the overlap between the gene sets annotated in both ontology terms. (D) Fragments per kilobase of transcript length per million reads (FPKM) for pathogen receptors with significantly increased expression in old PCs. Genes were identified from (C). Bars represent mean ± SEM derived from RNA-seq data. Venn diagrams illustrating the number of genes with (E) increased or (F) decreased expression in both old PCs and LPS-stimulated B cells from (Fowler et al., 2015). (G-L) qPCR analysis for (G) Tlr4, (H) Il1b (I) Il6, (J) Tnf, (K) Ccl3 and (L) Cxcl10 expression by young and old PCs treated with PBS or LPS (1 μg/mL) for 2 hours in vitro. Results are normalized to Gapdh expression. ND = not detected. Bars represent mean ± SEM from 3 independent experiments.
