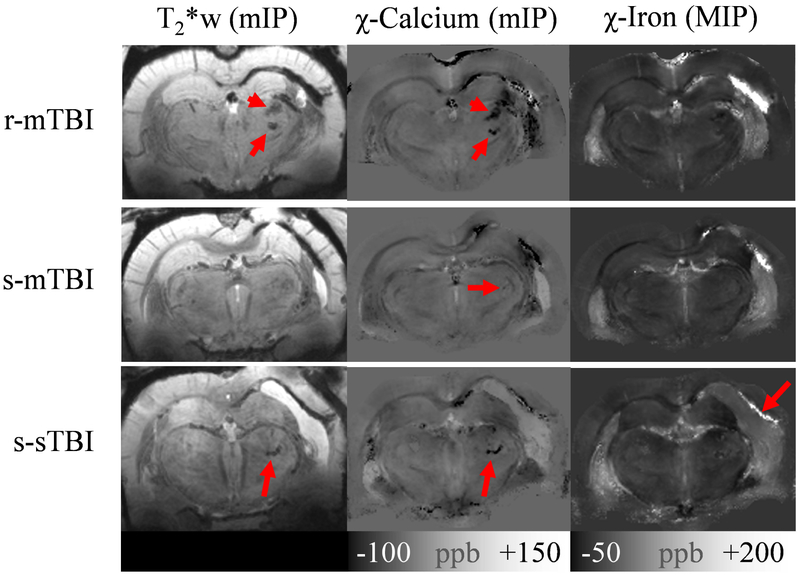
Figure 3.
Overview of in vivo imaging findings in the three injury groups. The top row shows the animal with r-mTBI that had the highest calcification volume (0.79 mm3) at week 4. The middle row shows one of the three s-mTBI animals in which a calcification was identified at week 4 (0.0098 mm3; confirmed by histology). The bottom row shows images of the only s-sTBI animal that showed a calcification on MRI (0.12 mm3; confirmed by histology. Images in the left column are minimum intensity projections (mIPs) of the T2*w magnitude images, those in the middle are mIPs of the susceptibility maps (delineating calcium deposits), and the images on the right show maximum intensity projects (MIPs) of susceptibility maps (delineating iron deposits). All projections were calculated over 580 μm.

