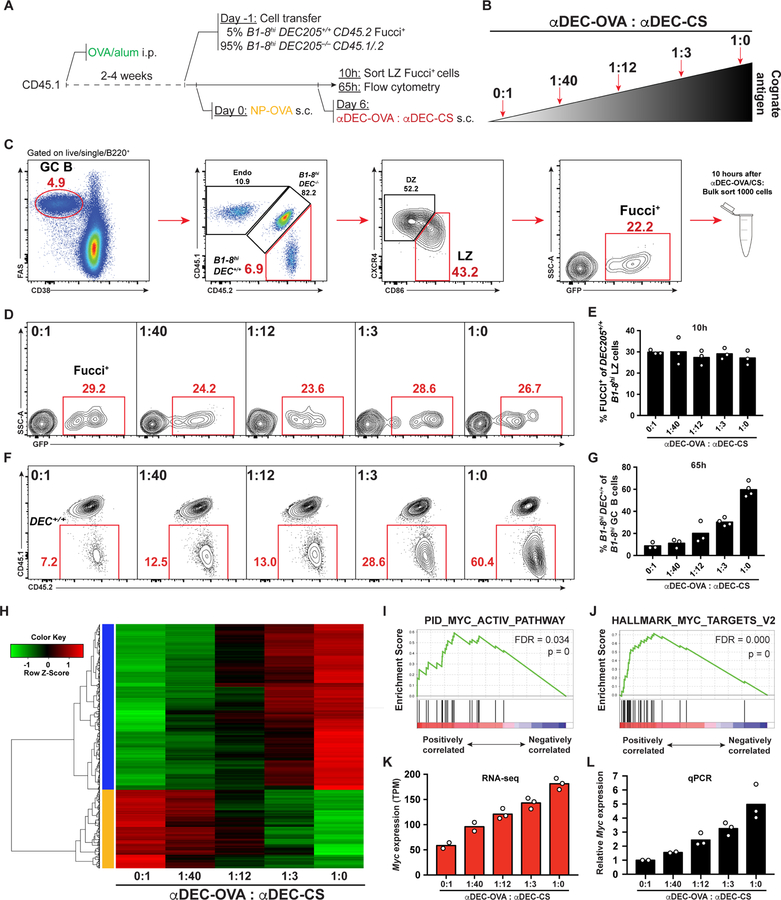
Figure 1. MYC pathway activation in GC B cells is proportional to T cell help.
(A-C) Schematic representation and gating strategy. Endo = Endogenous. (D) Representative GC B cells 10 hours after αDEC-OVA/CS treatment. (E) Quantification of (D) Each symbol represents 12 mice pooled to one group in three independent experiments. (F) Representative flow cytometry results showing percentage of B1–8hiDEC205+/+ among total B1–8hi GC B cells 65 hours after treatment with different amounts of αDEC-OVA (top left). Numbers in red indicate percentage of events in that gate. (G) Quantification of (F). Each symbol represents one mouse. Graph summarizes the results from 3–4 mice per group pooled from 3 independent experiments. (H) Heatmap and hierarchical clustering of proportionally increased or decreased genes expressed by LZ B1–8hiDEC205+/+Fucci+ GC B cells that were used for Gene Set Enrichment Analysis. (I and J) Gene Set Enrichment Plots for MYC pathway activated genes from pathway gene sets (I) and hallmark gene sets (J). FDR = False Discovery Rate. p = p-value. (K) Myc expression determined by RNA sequencing shown as Transcripts Per Million (TPM). (L) Real time PCR quantification of Myc expression performed on RNA from the same samples used for RNA sequencing. Results show the combined data from three independent experiments (see STAR Methods). See also Figure S1.

