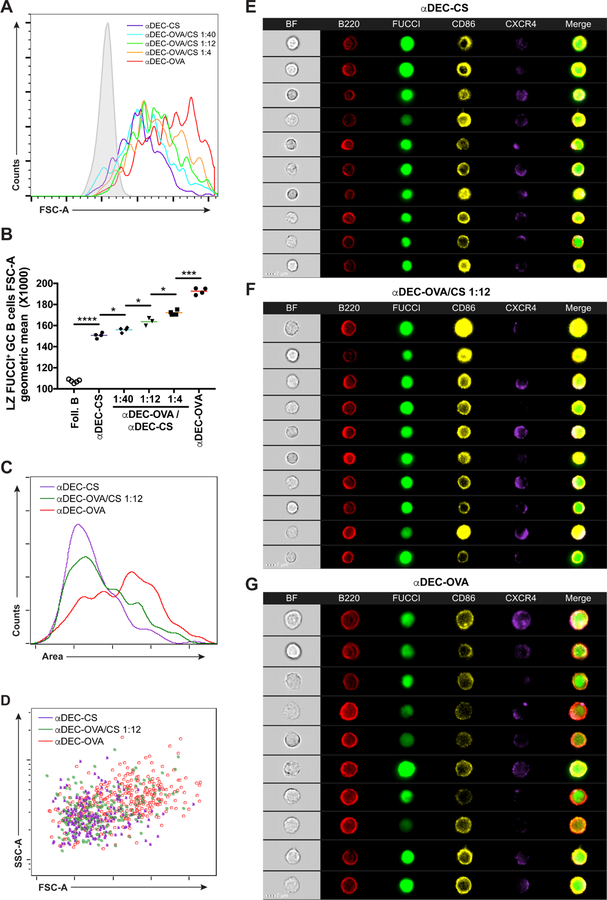
Figure 2. GC B cell size is proportional to MYC expression.
(A) Histogram shows representative forward scatter of LZ Fucci+ GC B cells 30 hours after graded αDEC-OVA administration. Solid grey represents follicular B cells. (B) Quantification of (A). Each symbol represents one mouse. Graph summarizes the results from 3 – 4 mice per treatment in two independent experiments. (C and D) Histogram (C) and dot plot (D) representation of LZ B1–8hiDEC205+/+Fucci+ GC B cells size by ImageStream analysis. Graph summarizes the results from 5 combined mice per treatment in two independent experiments. (E-G) ImageStream galleries showing LZ B1–8hiDEC205+/+Fucci+ GC B cells analyzed 30 hours after αDEC-CS (E), αDEC-OVA/CS 1:12 (F) or αDEC-OVA (G) injection. Scale bar = 7 μm. Two-tailed unpaired student’s t test was used in (B). *p < 0.05. ***p < 0.001 ****p < 0.0001. See also Figure S2.

