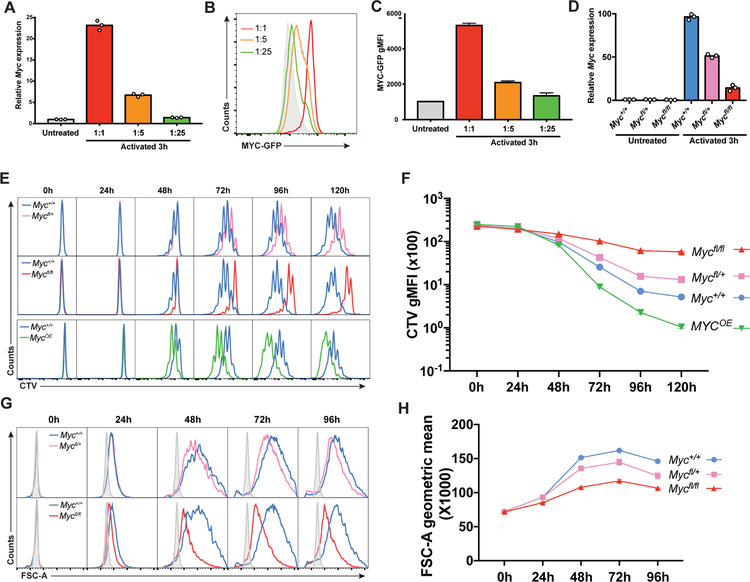
Figure 3. MYC expression is proportional to the magnitude of Tfh signals in vitro.
(A to C) Quantification of Myc mRNA by real time PCR (A) or of MYC-GFP protein by flow cytometry (B and C) after graded activation of wild type B cells with IL-4, IL-21, αCD40 and αCD180 either undiluted or diluted 1:5 or 1:25. Solid grey represents MYC-GFP− cells. Graph shows one representative experiment with three technical repeats of two independent experiments. (D) Quantification of Myc mRNA by real time PCR in B cells extracted from spleens of the indicated R26ERT2-Cre mice, cultured in the presence of 4-OHT for 12 hours and activated for 3 hours with IL-4, αCD40 and αCD180. (E) Histograms show CTV dye dilution by spleen B cells cultured for the indicated times with IL-4, IL-21, αCD40 and αIgM and 4-OHT. Blue = Myc+/+, pink = Mycfl/+, red = Mycfl/fl and green = R26StopFLMYC (MYCOE/+). (F) Quantification of (E). (G) Histograms show size for cells treated as in (E). Solid grey represents unactivated B cells. (H) Quantification of (G). Histograms and graphs in (E) to (H) show one representative experiment with three technical repeats of each time point and condition in two independent experiments. Error bars represent SEM. See also Figure S3.

