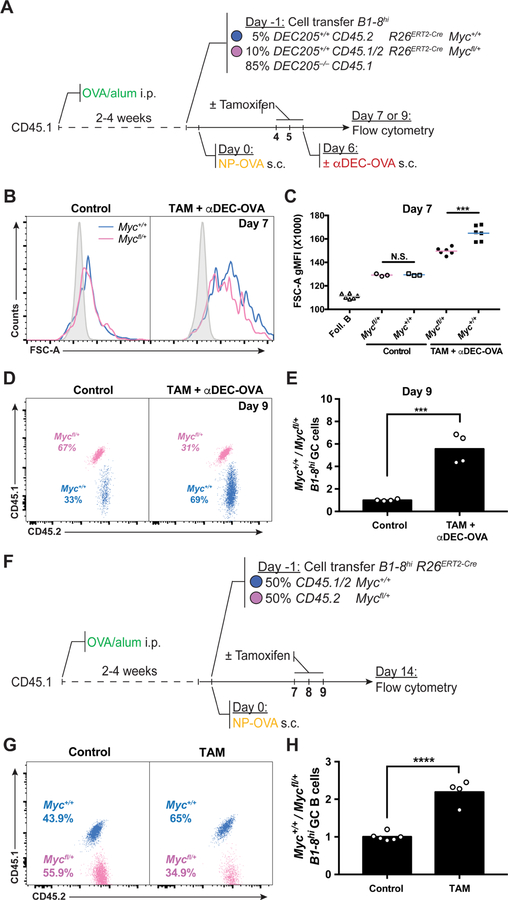
Figure 4. MYC proportionally regulates GC B cell expansion.
(A) Schematic representation of the experimental protocol for (B-E). (B) Representative histograms showing forward scatter of B1–8hiR26ERT2-CreDEC205+/+ GC B cells from Myc+/+ (blue) and Mycfl/+ (pink) mice without (left panel) or with (right panel) αDEC-OVA and tamoxifen administration 7 days after NP-OVA boost. Solid grey represents follicular B cells. (C) Quantification of (B). Each symbol represents one mouse. Summary of results from 3–6 mice in three independent experiments. (D) Representative dot plot showing the percentage of adoptively transferred B1–8hiR26ERT2-CreMyc+/+ and B1–8hiR26ERT2-CreMycfl/+ GC B cells in untreated control (left panel) or tamoxifen and αDEC-OVA (right panel) treated mice 9 days after NP-OVA boost. (E) Quantification of (D). Graph shows fold change of B1–8hiR26ERT2-CreMyc+/+ divided by B1–8hiR26ERT2-CreMycfl/+ in individual mice normalized to the average of the same in the control group. Summary of results from 4 – 6 mice in three independent experiments. (F) Schematic representation of the experimental protocol for (G) and (H). (G and H) Representative dot plots showing Percentage (G) and ratio (H, fold change over input) of GC B cells from the indicated mice 7 days after the first tamoxifen treatment. Each symbol represents one mouse. Data represents 3–6 mice in three independent experiments. Unpaired two-tailed student’s t test. N.S.: p > 0.05 (not statistically significant); ***p < 0.001 ****p < 0.0001. See also Figure S4 and Figure S5.

