
Figure 12.
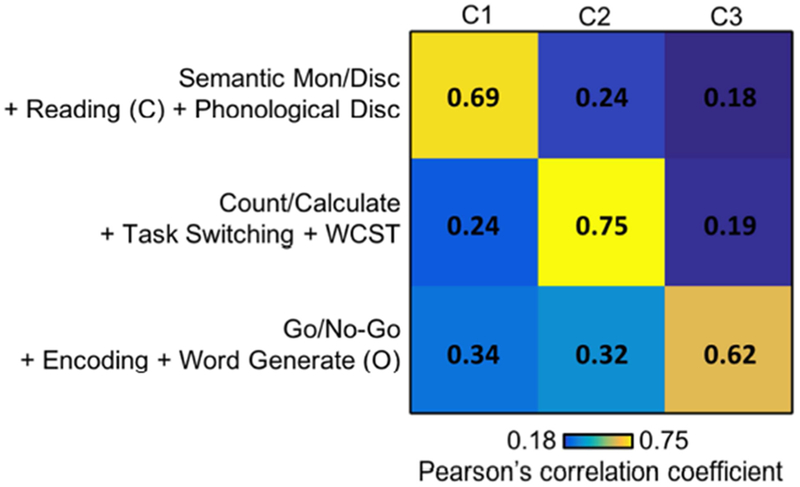
Goodness of fit of the author-topic model for IFJ. The matrix represents the correlations between IFJ’s co-activation patterns (columns) and the average activation maps of the top three tasks associated with each co-activation pattern (rows). The top tasks of each co-activation patterns are shown in Figure 11. The diagonal values (average r = 0.75) were larger than off-diagonal values (average r = 0.31), suggesting a good model fit.