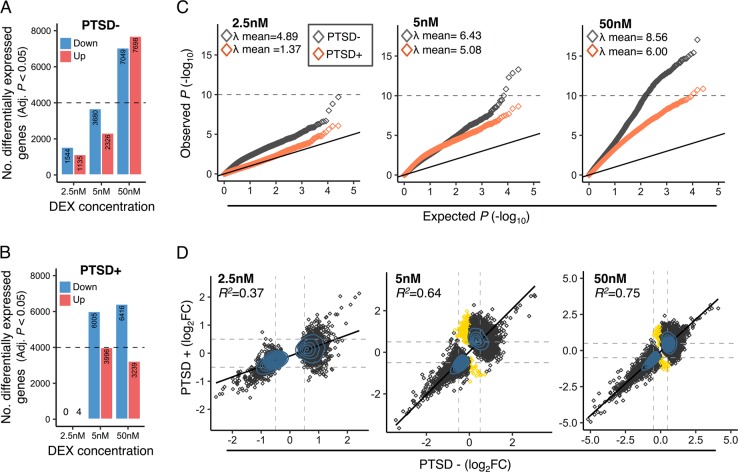
Fig. 2. Differential transcriptional response to DEX in PTSD.
DEX-stimulated changes in gene expression were evaluated separately for PTSD− and PTSD+ participants. A clear distinction for gene expression changes that were either suppressed or enhanced for DEX were identified for a PTSD− and b PTSD+ participants. c Quantile-quantile (QQ)-plots demonstrate an observed distribution of p-values, which greatly deviates from the expected uniform distribution across all three concentrations of DEX. The genomic inflation factor (λ, also defined as median X2) was computed to measure deviations of the observed genome-wide distribution of the test statistic from with the expected null distribution. A mean λ of 1 indicates no difference from the expected null distribution, while λ > 1 indicates marked shifts from the expected null distribution. d Concordance of genome-wide log2 fold-changes for all differentially expressed genes (Adj. P < 0.05) were computed in a dose-dependent manner and a linear regression model assessed the overall correspondence between PTSD− and PTSD+ participants. Gold points indicate gene expression changes that are unique to PTSD+ participants. Blue shading indicates a density distribution, whereby an excess of data points are depicted by a denser shading.

