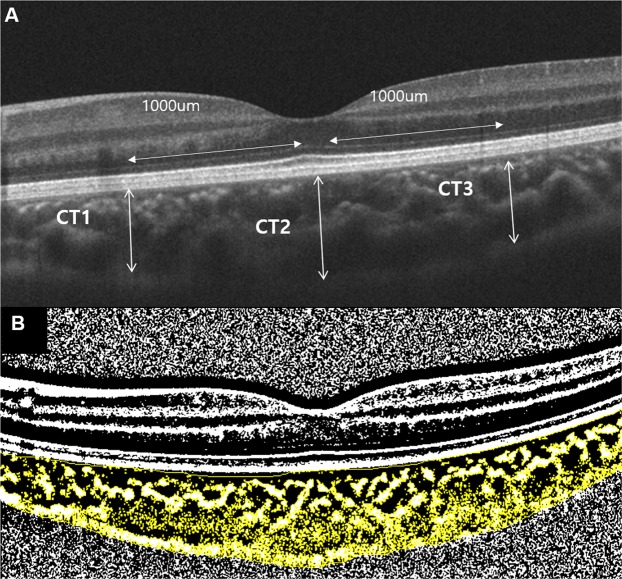
Figure 4.
Measurements of choroidal thickness and vascularity. (A) Nasal parafoveal choroidal thickness (CT1), subfoveal choroidal thickness (CT2), and temporal parafoveal choroidal thickness (CT3) were obtained using enhanced depth image optical coherence tomography. CT was measured as the distance between Bruch’s membrane and the choroid-scleral interface. (B) The subfoveal choroidal area with a width of 3 mm, centered at the fovea, was selected. Using ImageJ software, the image was binarized with Niblack’s method, and the ratio of vascular area (black pixels) to stromal area (white pixels) was quantified.

