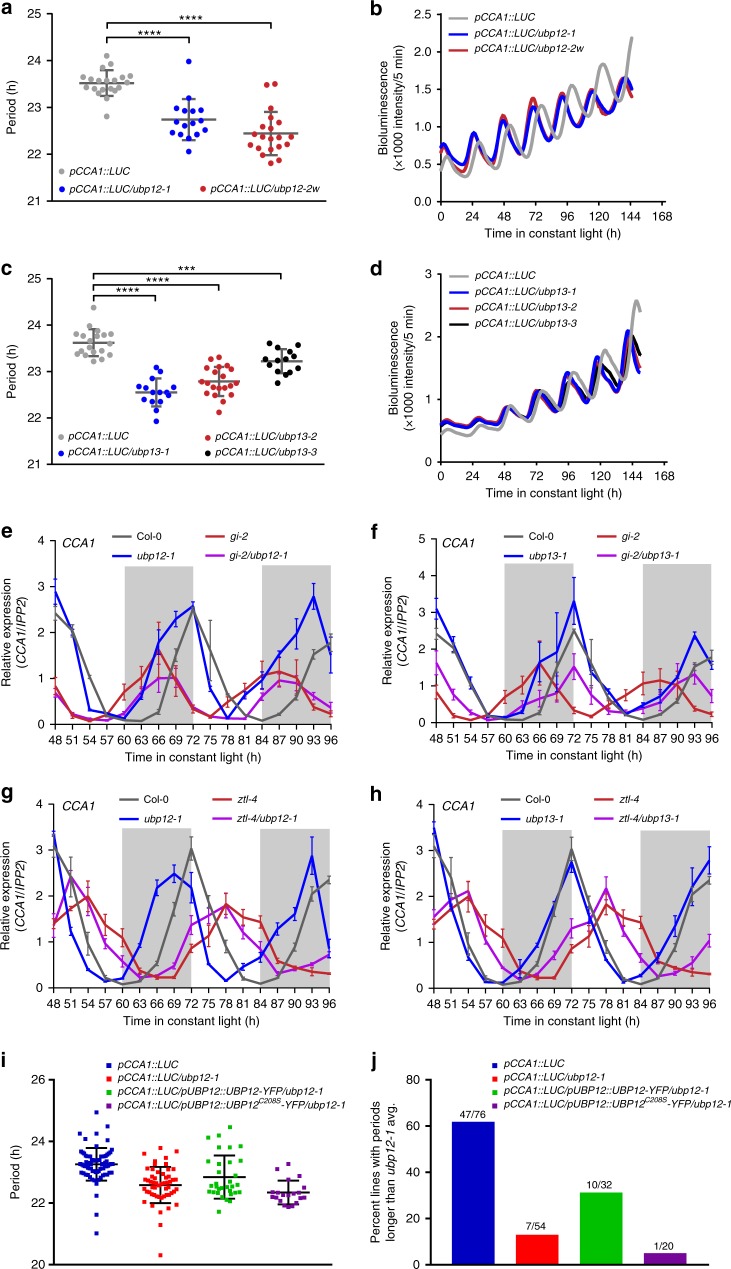
Fig. 2.
UBP12 and UBP13 regulate the circadian clock through the same pathway as GI and ZTL. a–d The ubp12 and ubp13 mutants have short period phenotypes. a, c The periods of circadian marker pCCA1:Luciferase (pCCA1::LUC) in the wild type (Col-0) (n = 20 for a and n = 19 for c), ubp12-1 (n = 16), ubp12-2w (n = 20), ubp13-1 (n = 15), ubp13-2 (n = 20), and ubp13-3 (n = 14) were measured with bioluminescent assays. Each symbol represents the period from one seedling, and the average period and standard deviation are labeled with gray bars. The significance of period changes between wild type and mutants were analyzed with a two-tailed Welch’s t-test (*** for p-value < 0.001; **** for p-value < 0.0001). Three biological replicates were performed with similar results, and one dataset is presented. b, d The average bioluminescence of the lines displayed in a and c were plotted against time after transfer from 12 h light/12 h dark entrainment conditions to constant light. e, f Circadian expression of CCA1 in Col-0, ubp12-1, ubp13-1, gi-2, gi-2/ubp12-1, and gi-2/ubp13-1 after transferring to constant light for 48 h from the entrainment conditions was measured using qRT-PCR. Subjective dark is colored with light gray. The data represent the average relative expression of CCA1 normalized to IPP2 from three biological replicates, and the error bars are the standard deviation. The same Col-0 and gi-2 data were plotted twice (in e and f) for clarity in the data presentation and for comparison with the other mutant lines. g, h The circadian expression of CCA1 in Col-0, ubp12-1, ubp13-1, ztl-4, ztl-4/ubp12-1, and ztl-4/ubp13-1 after transferring to constant light for 48 h from the entrainment conditions was measured using qRT-PCR. The data analyses and presentation are the same as e–f. The same Col-0 and ztl-4 data were plotted twice (in g and h). i The circadian period of pCCA1::LUC in the wild type (n = 76), ubp12-1 (n = 54), ubp12-1 mutant complemented with pUBP12::UBP12-YFP (n = 32) or deubiquitylating activity-dead pUBP12::UBP12CS-YFP (n = 20). Each symbol represents the period from one seedling, and the black bars indicate the average period and standard deviation. The wild type and ubp12-1 mutants are homogenous populations, and the complementation lines are individual T1 transgenic lines. The presented data are from three independent biological replicates. j Quantitation of the number of lines, from panel i, with periods greater than the average of the ubp12-1 mutant plus one standard deviation. The source data are provided as a Source Data file

