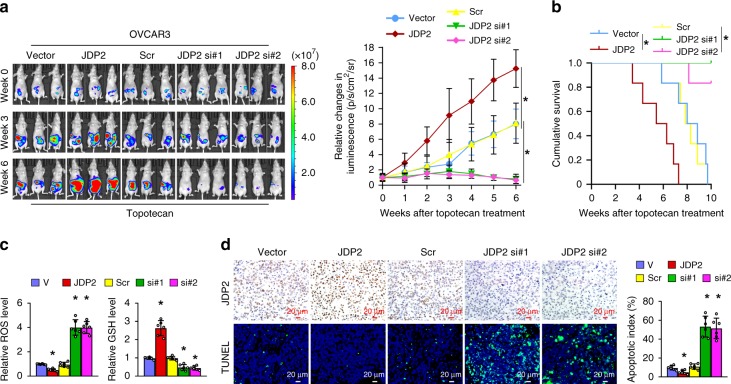
Fig. 9.
JDP2 confers resistance to genotoxic stress on cancer cells in vivo. a Representative images of tumor-bearing nude mice inoculated intraperitoneally with the indicated cells in response to Topotecan chemotherapy at the indicated times (left), and the relative change in the bioluminescence signal of intraperitoneal tumors in nude mice in response to Topotecan chemotherapy (right). n = 6 animals per group. b Kaplan–Meier survival of mice inoculated intraperitoneally with the indicated cells. n = 6 animals per group. c Relative levels of GSH (left) and ROS (right) in the indicated xenograft tumors. d IHC staining of JDP2 expression and TUNNEL analysis (left) and quantification (left) of the apoptotic index in the indicated xenograft tumors. Scale bar, 20 μm. Each error bar in panels c and d represents the mean ± SD of three independent experiments. *P < 0.05. Student’s two-tailed t test. Source data of Fig. 9a–d are provided as a Source Data file

