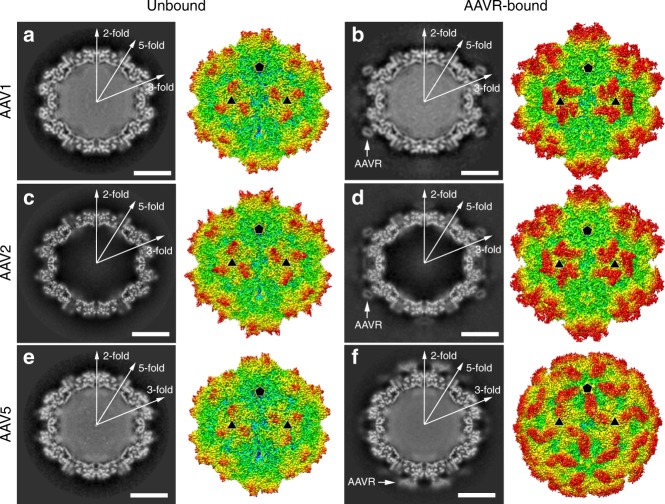
Fig. 1.
The cryo-EM structures. The central cross-sections through the cryo-EM maps and the rendered images of unbound AAV1 (a), AAV2 (c), and AAV5 (e) and AAVR-bound AAV1 (b), AAV2 (d), AAV5 (f) are shown in the left and right halves of each panel, respectively. The central cross-sections are shown with the icosahedral two-, three- and fivefold axes. The scale bars represent 100 Å. Depth cueing is used to indicate the radius by color (<90 Å: blue; 100–125 Å: from cyan to yellow; >140 Å: red). Icosahedral five- and threefold axes are represented by pentagons and triangles. Density for bound AAVRs is indicated by arrows in the central cross-sections

