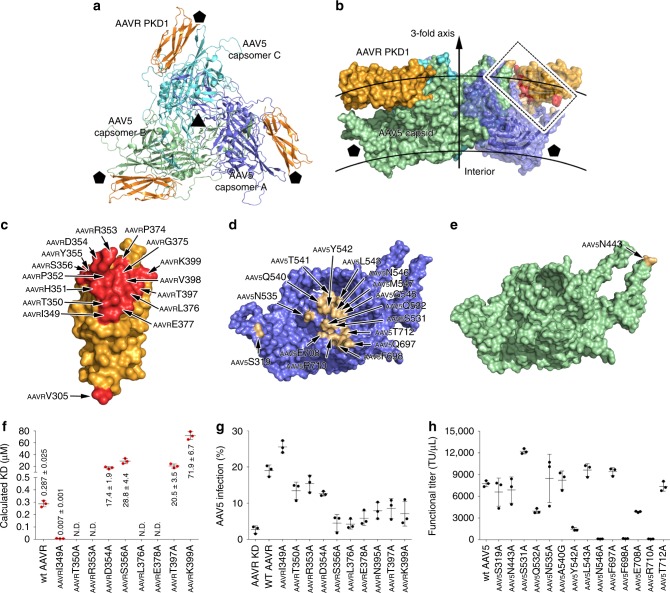
Fig. 2.
AAVR PKD1 binds with AAV5. a, b The structures of trimeric AAV5 capsomers in complex with AAVR are shown in ribbon representation from a top view (a) and as a covered surface from a perpendicular side view (b). The rough inner and outer boundaries of the viral capsid are marked with gray arcs in b. The three AAV5 capsomers are colored blue, green, and cyan, respectively. Bound AAVRs are shown in orange. The five- and threefold axes are indicated by pentagons and triangles, respectively. The interacting residues on one AAVR PKD1 and the corresponding AAV5 capsomers are colored red and gold, respectively, in b, and the interacting region is framed with dashed lines. The residues in PKD1 at the interface are shown in red (c); the interface residues in AAV5 capsomer A (d), and capsomer B (e) are colored gold and labeled. See also Supplementary Table 3. f A total of nine AAVR mutants were tested for their ability to bind AAV5 by BIAcore sensorgrams in triplicate experiments. The calculated KD values for the binding of each mutant to AAV5 are summarized as the mean values of three experiments with standard errors. The original curves are presented in Supplementary Fig. 6. g The impact of AAVR PKD1 mutants overexpressed in AAVR-silenced HEK293T cells on AAV5 transduction. Cells were transfected with wt AAVR or different AAVR mutants as indicated followed by infection with AAV5-mCherry at an MOI of 3 × 10⁶ vg cell−1. The percentage of mCherry-positive cells are plotted as means ± standard errors (n = 3). Expression of wt AAVR and mutant AAVRs was evaluated by immunoblot analysis with β-actin as a control (see Supplementary Fig. 13). h AAV5 molecules bearing capsid mutations at the receptor binding sites impacted viral transduction. HEK293T cells were infected with serial dilutions of AAV5 mutants starting at an MOI of 3 × 10⁶ vg cell−1. Functional titer refers to the number of virus particles that can infect the cell in every microliter. GFP expression was determined 48 h post-transduction. The functional titers are plotted as means ± standard errors (n = 3). Source data are provided as a Source Data file

