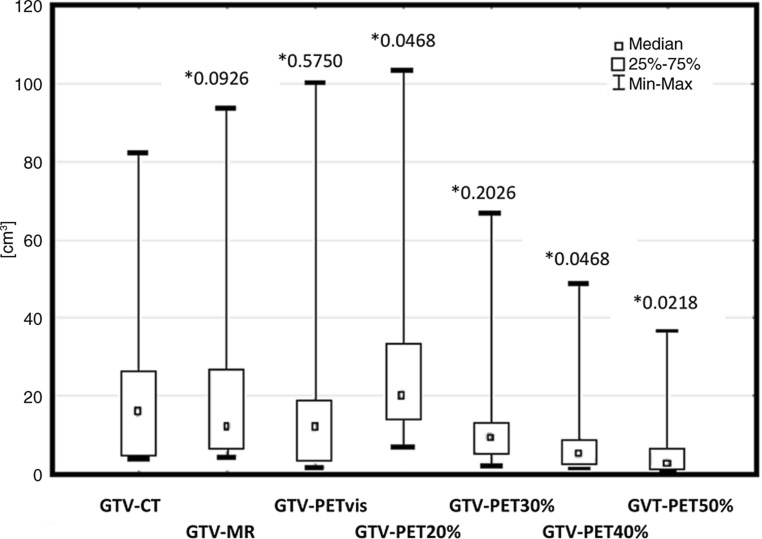
Fig. 3.
Statistical comparison of primary tumor volumes (gross tumor volume, GTV) delineated using visual method and fixed threshold method, obtained from computed tomography (CT), magnetic resonance (MRI) and 18-fluorine-labeled fluorodeoxyglucose positron emission tomography (PET) images. The graph shows the median, the average and the level of statistical significance p (asterisk) of obtained results. Min minimal value, Max maximal value, vis visual method of GTV delineation, PET20%, PET30%, PET40%, PET50% volumes covered by 20%, 30%, 40%, 50% threshold of SUVmax, respectively

