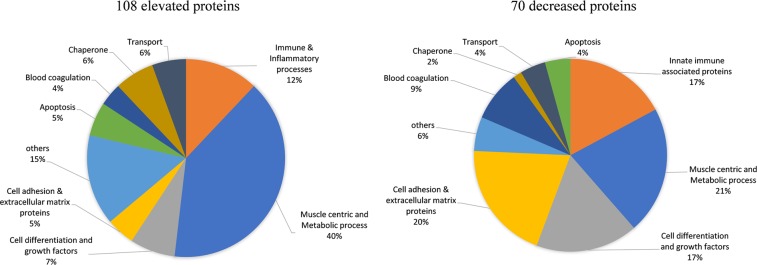
Figure 1.
Pie chart depicting the biological process and molecular function of serum protein biomarkers identified in GC-naïve DMD (n = 18) compared to healthy controls (n = 12). The elevated proteins (108 in total) were mostly of muscle origin followed by some pro-inflammatory and cell adhesion proteins while the decreased proteins (70 in total) consisted mostly of cell adhesion and cell differentiation factors and some metabolism associated and innate immunity-associated proteins.

