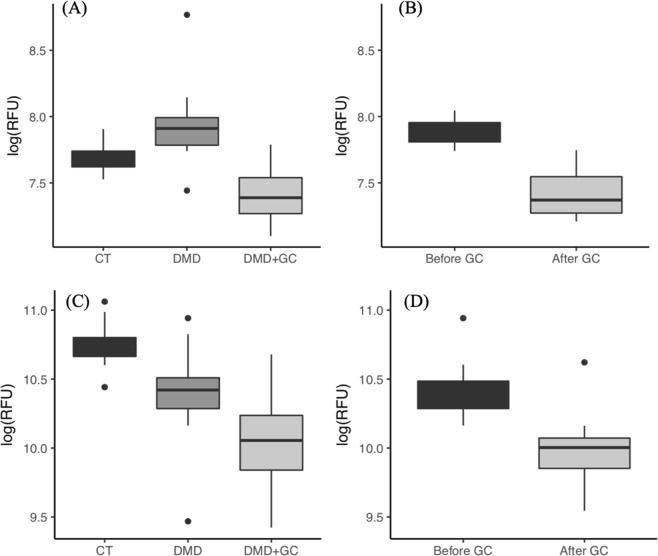
Figure 6.
Representative exemplar of DMD associated biomarkers that responded to GC treatment. Left column shows cross-sectional comparison of the biomarker concentrations in healthy (CT) controls (n = 12), GC-naïve DMD (n = 18), GG treated DMD (n = 31), p values are adjusted for multiple testing. Right panel shows paired t-test analysis of the same biomarker in pre and post GC treated DMD patients (n = 10). (A,B) Lumican was elevated in GC-naïve DMD patients then decreased following GC treatment (****p < 0.001, ***p < 0.02). (C,D) Osteomodulin was slightly lower in GC-naïve DMD patients relative to controls and further decreased following GC treatment (**p = 0.015, *p < 0.05).

