Figure 3.
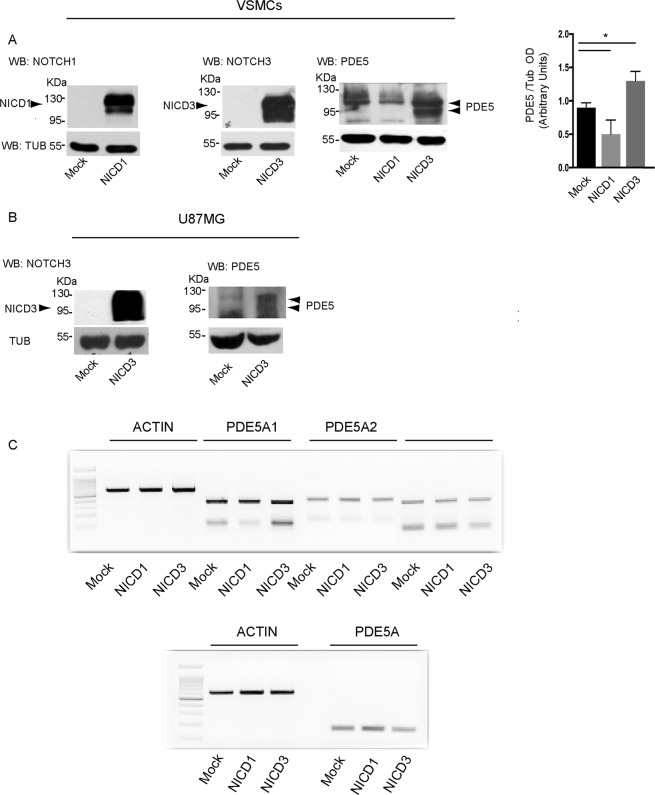
NOTCH3 regulates PDE5 expression. Representative western blot showing decrease of PDE5 protein levels in human VSMCs transfected with NICD1 and increase of PDE5 expression upon NICD3 intracellular domain transfection in human VSMCs (A) and in U87MG cells (B). Bottom panel in (A) represents densitometric analysis on four independent experiments. Bars represent ±SD *p < 0.05. Representative semi-quantitative RT-PCR showing mRNA levels of total PDE5A, PDE5A1, A2 and A3 isoforms in NICD1 or NICD3 overexpressing human VSMCs (C). Three independent experiments were performed.

