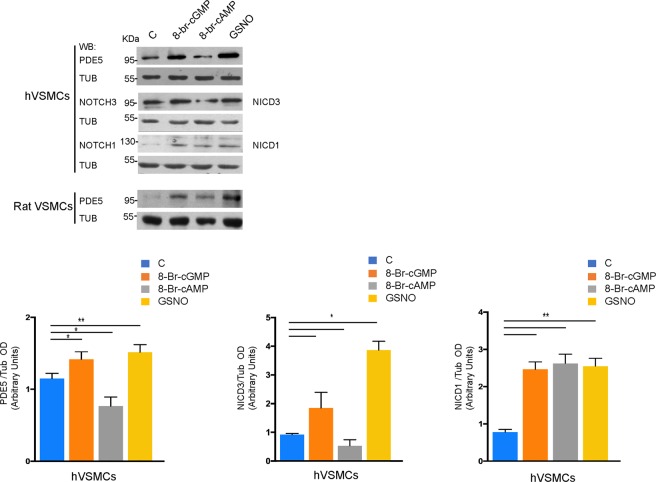
Figure 4.
PDE5 expression after cGMP or cAMP stimulation of human and rat VSMCs. Representative western blot showing PDE5, NOTCH1 and NOTCH3 protein levels in human VSMCs (A) and PDE5 protein levels in rat VSMCs 24 hr post treatment with 0.5 mM 8-Br-cGMP, 0.5 mM 8-Br-cAMP and 100 nM GSNO respectively (B). Histograms represent densitometric quantification of western blot analysis in (A). Bars represent ±SD. *p < 0.05 on three experiments.

