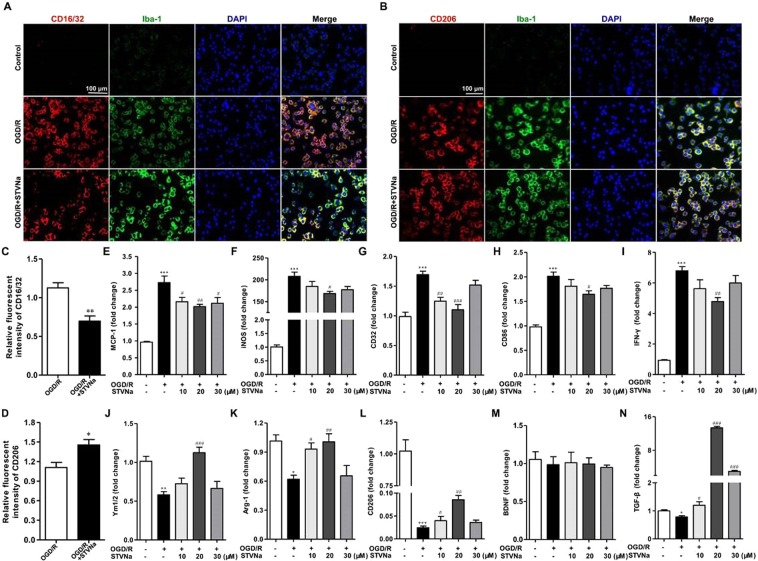
Figure 3.
STV-Na inhibits M1 polarization and promotes M2 polarization in BV2 microglial cells after OGD/R. Representative double-immunofluorescence staining for CD16/32 or CD206 and Iba-1 markers in BV2 microglial cells obtained from STV-Na or vehicle treatment after OGD/R, or from Normal. Scale bar: 100 μm. (A) BV2 microglial cells co-stained for CD16/32 (M1 marker) (red) and Iba-1(green). (B) BV2 microglial cells co-stained for CD206 (M2 marker) (red) and Iba-1 (green). (C) Quantification of the percentage of CD16/32+/Iba-1+ cells among total Iba-1+ cells. (D) Quantification of the percentage of CD206+/Iba-1+ cell among total Iba-1+ cells. (E,F,G,H,I,J,K,L,M,N) RT-PCR analysis of M1 (MCP-1, iNOS, CD32, CD86, IFN-γ) and M2 (Ym1/2, Arg-1, CD206, BDNF, TGF-β) markers in BV2 microglial cells after OGD/R. Data are represented as mean ± SD, *P < 0.05, **P < 0.01, ***P < 0.01, versus control; #P < 0.05, ##P < 0.01, versus OGD/R group.

