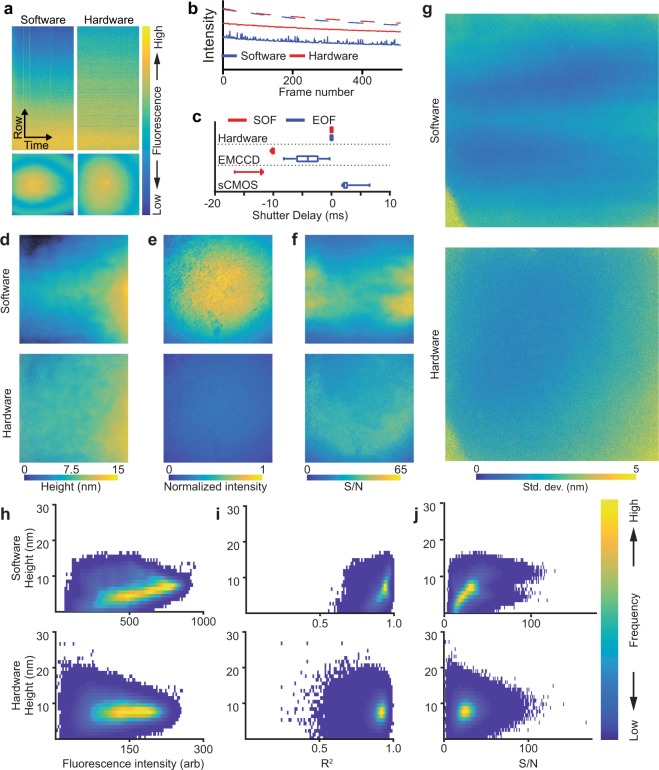
Figure 4.
Hardware based synchronization minimizes latency-induced artifacts in SAIM. (a) Top: fluorescence kymographs of the top half of the center pixel column of an sCMOS camera imaging a homogeneous dye monolayer. Bottom: Full sensor single frame images from the same acquisition sequence. (b) Plot of average row intensities (2048 pixels) from the series in a. Dashed lines represent the center pixel row, solid lines the top pixel row. (c) Distribution of excitation shutter delays at the start of frame (SOF) and end of frame (EOF) relative to the camera’s exposure signal over 50 frames. Lines represent the average of 50 frames, boxes the center quartiles and whiskers the minimum and maximum values. (d–f) Lipid bilayer height, fluorescence intensity and signal-to-noise ratio in SAIM reconstructions from image sets acquired with software or hardware synchronization. (g) Standard deviation from SAIM reconstructions of lipid bilayer height. Each of 6 equivalent regions of the sample were imaged first with hardware synchronization and then immediately after with software synchronization. The horizontal bands in the software image follow the center-out readout pattern of the sCMOS camera. (h–j) Lipid bilayer height distributions in SAIM reconstructions vs. fluorescence intensity, coefficient of determination and signal-to-noise ratio with the excitation under software (top row) or hardware (bottom row) control. Images in a and d–g reflect the full sensor area of 2048 × 2048 pixels, corresponding to a 147.9 × 147.9 μm field of view. Data in a and b were normalized to the average intensity in the first exposure for comparison.

