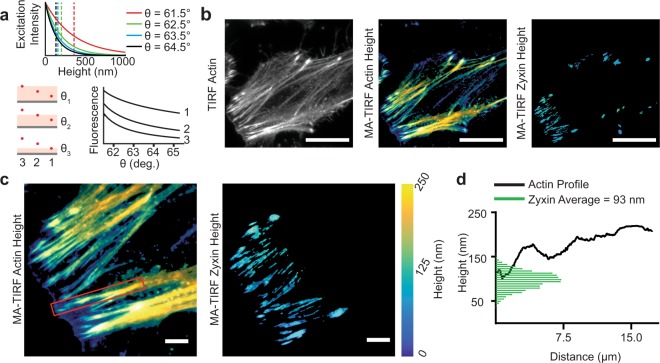
Figure 5.
Implementation of circle scanning multiangle TIRF (MA-TIRF). (a) Concept of MA-TIRF. Top: The evanescent excitation field intensity (solid lines) as a function of height above the glass-liquid interface and penetration depth (dashed lines) for various angles of incidence. Lower left: Schematic representation of fluorescent probes (red dots) at 300, 200 and 100 nm (3, 2 and 1, respectively) from the glass-liquid interface. Lower right: Theoretical intensity profiles as a function of angle of incidence for the 3 fluorescent probes. (b) Widefield and height reconstructions of phalloidin-AF560 and mEmerald-Zyxin in a fixed HeLa cell. Scale bars 25 μm. (c) Enlarged view of the leading edge of the cell in b. Scale bars 5 μm. (d) Reconstructed actin height profile (solid black line, red box in c) and zyxin height distribution (green bars, non-zero fits from c).

