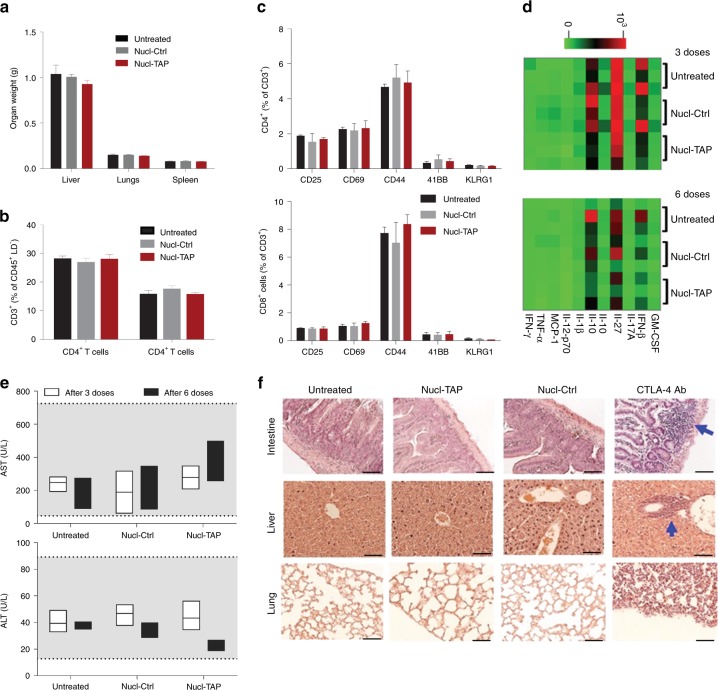
Fig. 5.
Toxicity in mice treated with Nucl-TAP. Balb/c mice (8 mice/group) were administered with Nucl-TAP or Nucl-Ctrl, six times every 3 days, except for the immunohistochemistry analysis (panel f) where mice were treated three times. Two days post last administration mice were sacrificed and analyzed. a Organ weight. b CD4/CD8 T cell ratio in the spleen. c Activation markers expressed on CD4+ and CD8+ T cells isolated from the spleen. Data represent means and SEM. d Cytokine levels in the serum of mice after three or six administrations of Nucl-TAP. Heatmap shows log-transformed cytokine concentration values for the experimental groups (3 mice/group). e Liver pathology. ALT and AST in the circulation were determined by ELISA after three or six administrations of Nucl-TAP. Shaded area represents normal levels of ALT or AST in Balb/c mice (from The Jackson Laboratories (MPD, http://phenome.jax.org/)). Data represent box plot analysis. f Inflammatory responses in tissue sections stained with hematoxylin and eosin and visualized by light microscopy at ×40 magnification (scale bar: 25 µm). One group of mice was also treated with 200 µg of CTLA-4 Ab that elicits a comparable antitumor effect27,41. Arrows indicate inflammatory foci in mice. a–c Statistical analyses using Kruskal–Wallis and Dunn posttest. e Statistical analyses using two-way ANOVA

