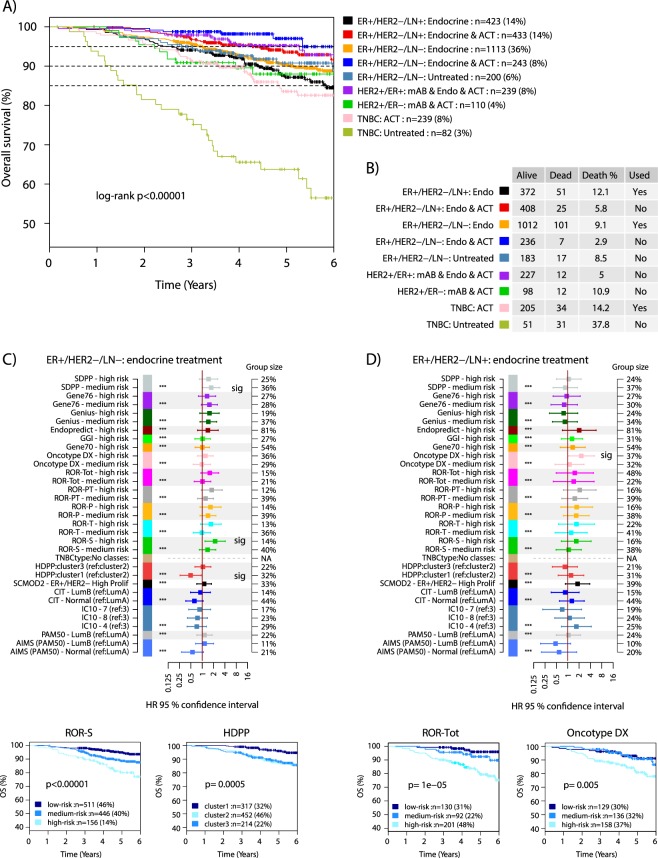
Figure 4.
Outcome analyses for clinical assessment groups and gene signatures in ER+/HER2− disease. (A) Kaplan-Meier plot of OS for the nine clinical assessment groups using all available samples. Percentages in parentheses represent proportion of entire cohort. (B) Table of events per clinical assessment group, outlining the number of cases with events, and a note on whether a group is kept for subsequent outcome analysis. (C) Forest plot of hazard ratios (HR) with 95% confidence interval for each signature class from multivariable Cox regression analysis using tumor size, patient age, lymph node status (where applicable), and tumor grade as covariates in the 1113 ER+/HER2−/LN− tumors with endocrine treatment only. Signature classes smaller than 8% of the total population are excluded from multivariable analysis. If not otherwise stated, the reference group is the low-risk group for a signature. Significant classes marked (sig). Bottom: selected Kaplan-Meier plots for the ROR-S and HDPP signatures in these cases. (D) Similar forest plot as in C but for the 423 ER+/HER2−/LN+ tumors with endocrine treatment only. Significant classes marked (sig). Bottom: selected Kaplan-Meier plots for the ROR-Tot and Oncotype DX signatures in these cases. * indicates significance level of a likelihood ratio test. ACT: adjuvant chemotherapy. Endo: endocrine treatment. mAB: anti-HER2 blockade. P-values in Kaplan-Meier plots were calculated using the log-rank test.

