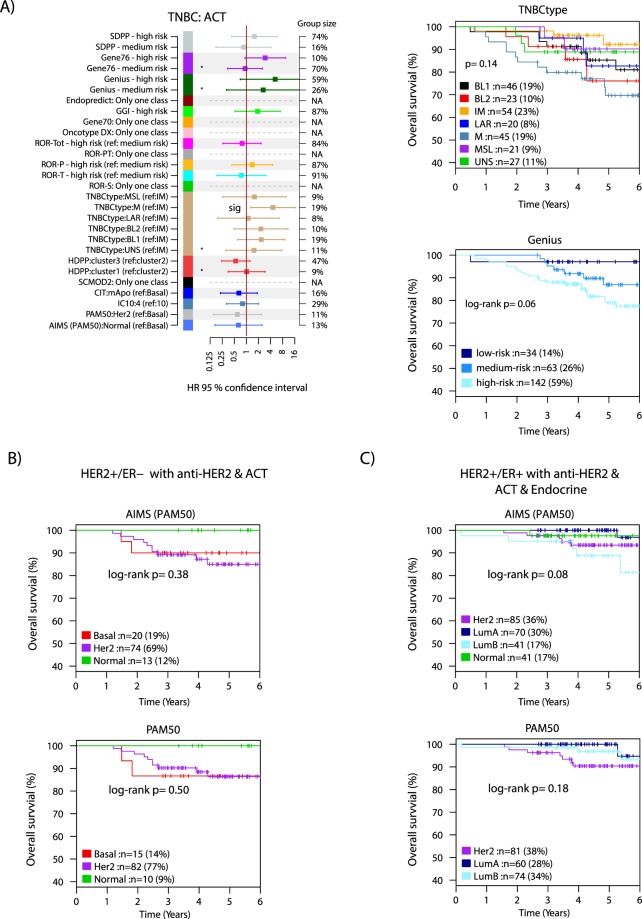
Figure 5.
Outcome analyses in TNBC and HER2+ disease. Signature classes <8% are excluded from multivariable analysis. If not stated, the reference group is the low-risk group for a signature. (A) Forest plot displaying hazard ratios (HR) with 95% confidence interval for respective signature class from multivariable Cox regression analysis using tumor size, patient age, lymph node status, and tumor grade as covariates in the 239 TNBC tumors with adjuvant chemotherapy. Significant classes marked (sig). For several signatures only one class existed, thus no values were calculated. Right: selected Kaplan-Meier plots for the TNBCtype and Genius signatures in these cases. (B) Kaplan-Meier plots of PAM50 subtypes defined through the single sample predictor AIMS or a centroid-based approach in HER2+/ER− disease treated with combined HER2-blocade and adjuvant chemotherapy. (C) Kaplan-Meier plots of PAM50 subtypes defined through the single sample predictor AIMS or a centroid-based approach in HER2+/ER+ disease treated with combined HER2-blocade, endocrine therapy, and adjuvant chemotherapy. ACT: adjuvant chemotherapy. Endo: endocrine treatment. P-values in Kaplan-Meier plots were calculated using the log-rank test.

