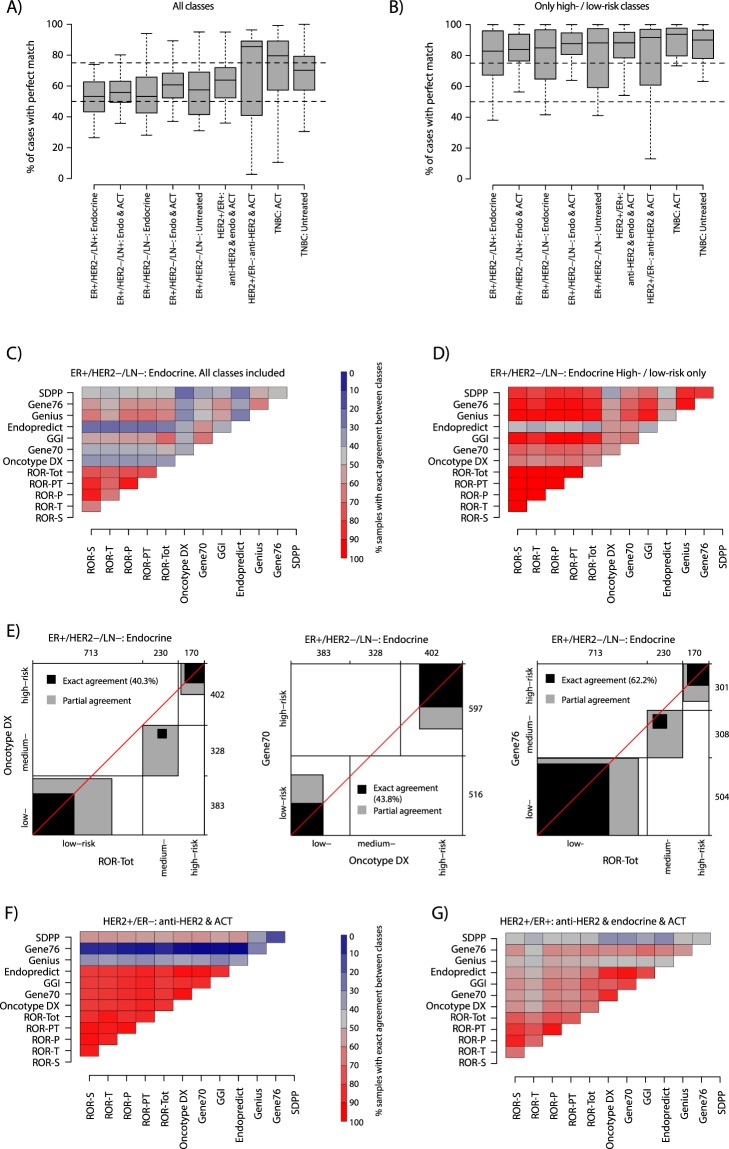
Figure 6.
Signature class consensus for risk prediction signatures. (A) Distribution of exact agreements between risk prediction signature pairs summarized by clinical assessment group. Analyzed risk prediction signatures include ROR variants, Oncotype DX, Gene70, GGI, Endopredict, Genius, Gene76 and SDPP. For each compared signature pair the exact classification agreement using all available classes (low-, medium/intermediate-, and high-risk) was calculated. Next, all agreement values from all signature combinations were summarized into a box plot for each assessment group. (B) Same analysis as in A, but now only for comparisons after omitting medium/intermediate-risk classified samples. I.e., all patients with a medium/intermediate-risk prediction in a signature pair comparison were omitted before calculating the exact agreement. (C) Percentage of exact risk class agreement for risk prediction signature pairs in ER+/HER2−/LN− endocrine treated samples using all available signature classes in the individual comparisons. The heatmap corresponds to all values included in the corresponding assessment group box plot in A. (D) Similar display as in C, both now for low-risk and high-risk classified samples only in ER+/HER2−/LN− endocrine treated patients. In this analysis, all patients with a medium/intermediate-risk prediction in a signature pair comparison were omitted before calculating the exact agreement. (E) Specific agreement charts for Oncotype DX versus ROR-Tot (left), Gene70 versus Oncotype DX (center), and Gene76 versus ROR-Tot (right) in ER+/HER2−/LN− endocrine treated samples similar as described32. Briefly, rectangles are drawn for each level of the test outcomes, i.e., low-, medium/intermediate-, and high-risk, based on the row and column cumulative totals. The boundaries of the rectangles along both axes represent the number of tumors categorized as that outcome group for each test. Black squares within the rectangles represent exact agreement between the levels of the two tests and are of size based on the cell frequencies and located according to the cumulative totals of the previous levels. Gray rectangles represent partial agreement, where the scores from one test are within one level of those from the other test, i.e., a low-risk prediction in one test but medium/intermediate-risk in the other test. White areas within the rectangle reflect disagreement by more than one level, i.e., low-risk in one test and high-risk in the other test. (F) Percentage of exact risk class agreement for risk prediction signature pairs in the HER2+ER− assessment group using all available signature classes in the individual comparisons. (G) Percentage of exact risk class agreement for risk prediction signature pairs in the HER2+ER+ assessment group using all available signature classes in the individual comparisons. ACT: adjuvant chemotherapy. Endo: endocrine treatment.

