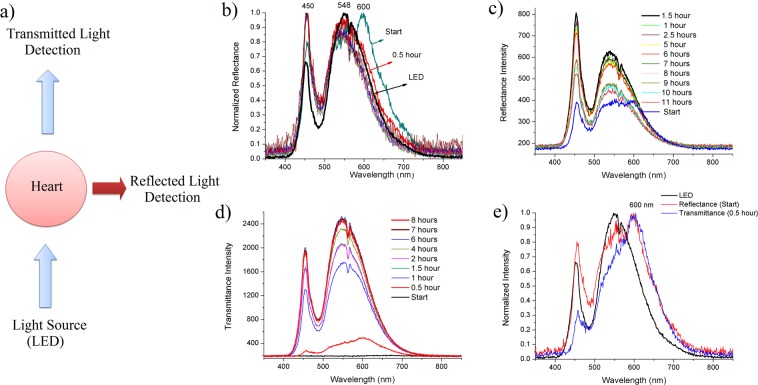
Figure 3.
Spectral analysis of the decellularization process using the fiber optic spectrophotometer. (a) Schematic diagram of the setup of spectral measurements. (b) Normalized intensities (0–1) of the reflectance spectra versus wavelength obtained during the perfusion with SDS and the LED spectrum. (c) Absolute intensities of reflectance spectra demonstrating maximum values at between 1 and 2 hours. (d) Absolute intensities of transmittance spectra showing an overall increase over time. (e) Normalized (0–1) spectra of reflectance at the initial moment of SDS perfusion, and transmittance at 30 minutes of SDS perfusion, compared with the light source profile (LED), evidencing a band shift at 600 nm.

