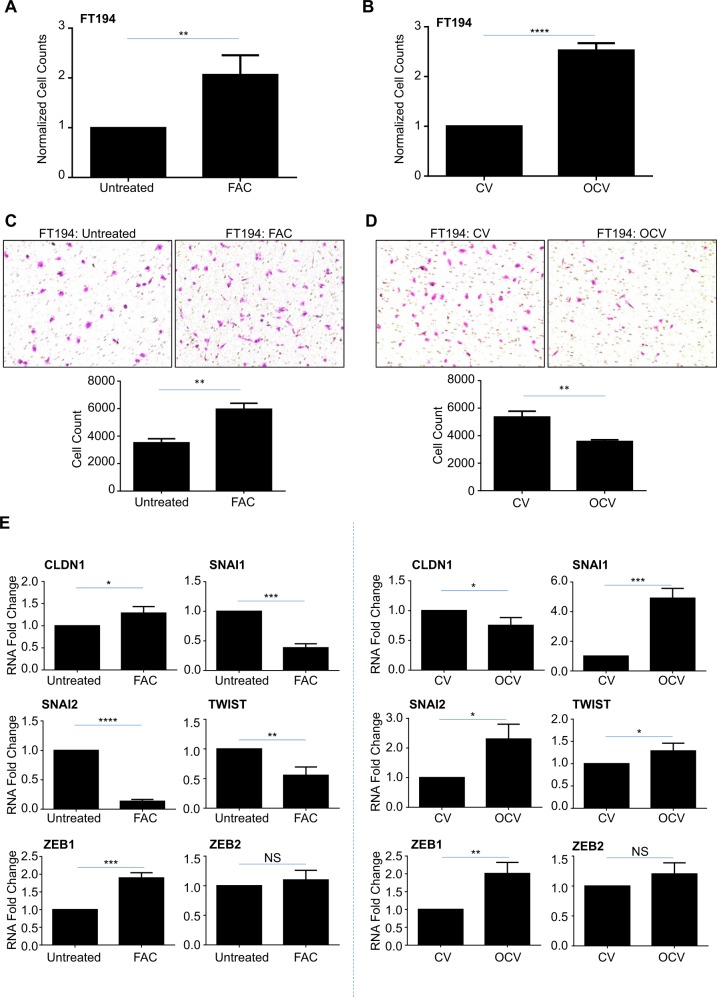
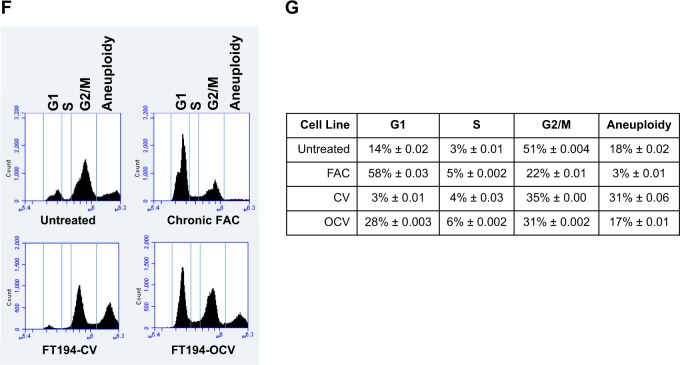
Fig. 3. Chronic iron exposure and transformed FTSECs elicit altered migratory and proliferative capacities.
a Untreated and 250 nM FAC-treated FT194 cells were seeded at 500 cells/cm2 and maintained over a period of 35–134 days (p = 17–39). Representative cell counts from untreated and FAC-treated cells on days 48, 67, 90, and 138 are presented. b FT194-CV and FT194-OCV cells were seeded at 500 cells/cm2 (p = RV + 7) and maintained in culture for 10 days prior to counting; the graph represents three independent replicates. Light microscope images of migrated untreated and FAC-treated (c; p = 30, day 104) as well as CV and OCV (d; p = RV + 10) FT194 cells. Images were captured at ×100 magnification, as detailed in the “Materials and methods” section. For quantification, migrated cells were counted from each independent replicate. e RNA was isolated from untreated and FAC-treated FT194 cells (p = 20, day 69) to assess mRNA expression of the indicated EMT markers via real-time PCR. Data represent three independent experiments. f, g Cell cycle analyses were completed for untreated and chronic FAC-treated FT194 cells (p = 21–22, days 71–74) as well as FT194-CV and FT194-OCV cells (p = RV + 3). For all panels, the results shown are representative of three independent experiments


