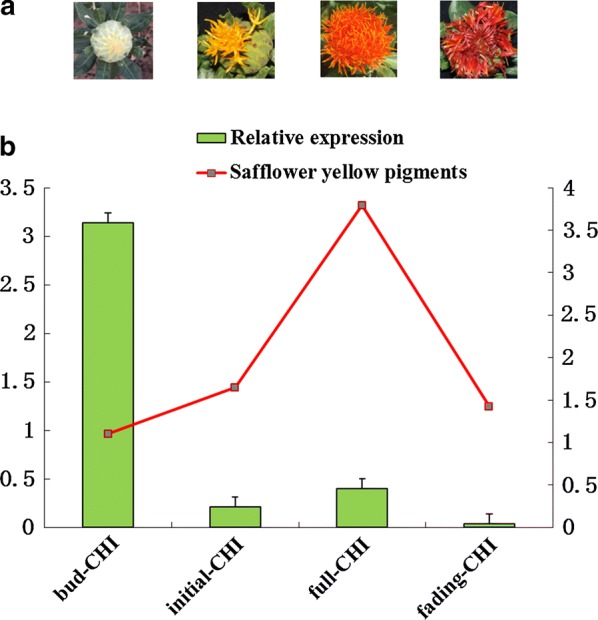
Fig. 4.

The correlation between expression of CtCHI gene and biosynthesis of flavonoids at various flowering stages of safflower. a Different flowering stages of safflower; b RT-qPCR transcript levels of CtCHI gene which are indicated in bars while the synthesis of safflower yellow pigment at various developmental stages are presented as red letter boxes. The 18s ribosomal RNA gene was used as an internal control. Error bars indicate the SE (n = 3)
